Estrategia de media móvil de envolvente dinámica
Descripción general
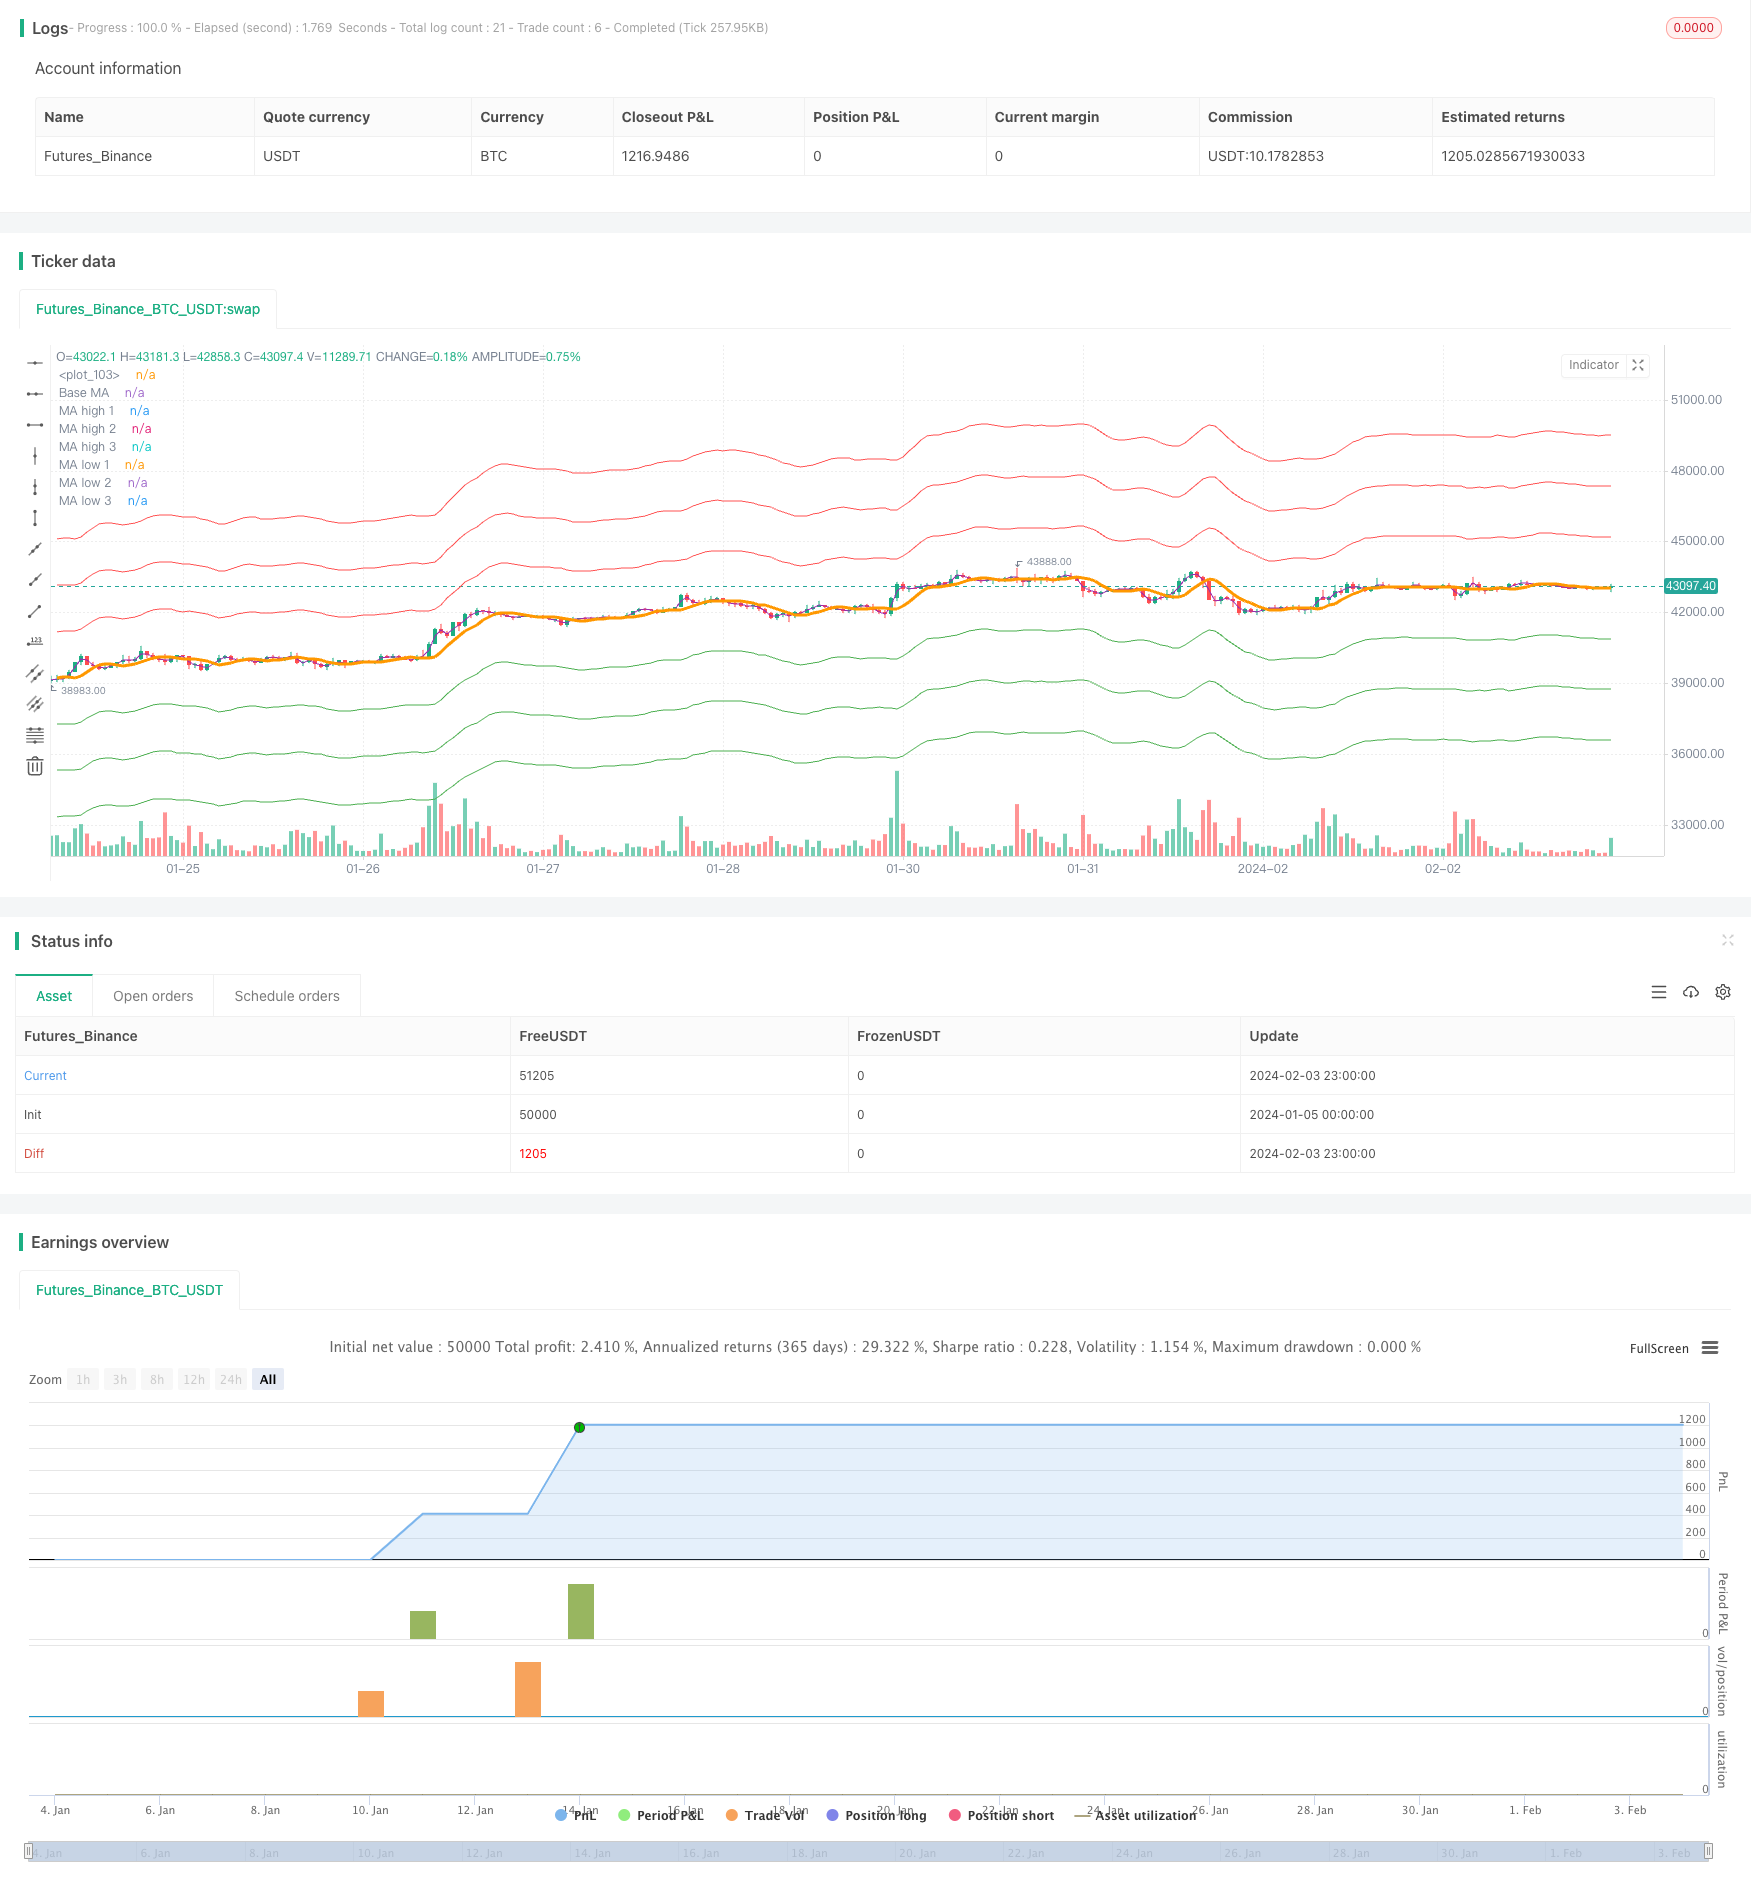
La estrategia se basa en la media móvil y en la línea de pared dinámica, lo que permite el comercio bidireccional de múltiples espacios. Se trata de una estrategia de seguimiento de los precios que rompen la línea de pared para establecer posiciones y se cerrará cuando el precio vuelva a caer por debajo de la media de referencia. La estrategia se aplica a las acciones y las monedas digitales con una tendencia más evidente.
Principio de estrategia
En primer lugar, la estrategia calcula el promedio de referencia basado en el tipo y la longitud de la línea media elegida por el usuario. Las líneas medias comunes incluyen SMA, EMA, etc.
Luego, se calcula una línea de red ascendente y descendente de acuerdo con los parámetros porcentuales establecidos por el usuario. Por ejemplo, el 5% representa una fluctuación de precio ALLOWED_BRACKET105% para activar la creación de posiciones. El número de líneas de red puede ser personalizado.
En las reglas de entrada a la bolsa, si se rompe la línea de la red inferior, se hace más; si se rompe la línea de la red superior, se hace vacío. Las reglas son muy simples y claras.
Finalmente, cuando el precio vuelve a caer por debajo de la media de referencia, se eliminan todas las posiciones. Este es un punto de salida de la tendencia de seguimiento.
Cabe señalar que la estrategia permite la creación de posiciones divididas. Si hay varias líneas de cobertura, el dinero se distribuye proporcionalmente. Esto evita el riesgo de juego unilateral.
Análisis de las ventajas
Las principales ventajas de esta estrategia son las siguientes:
Implementa la función de seguimiento automático de tendencias. El uso de líneas medias para determinar la dirección de las tendencias es muy común, por lo que es una forma eficaz de hacerlo.
El uso de filtros de enlace para filtrar parte del ruido evita el problema de las transacciones demasiado sensibles y innecesarias. La configuración razonable de los parámetros puede optimizar considerablemente la rentabilidad de la estrategia.
El posicionamiento dividido aumenta la resiliencia de la estrategia. Incluso si una brecha unilateral falla, las otras direcciones pueden seguir funcionando bien. Esto optimiza la relación riesgo-beneficio en general.
Permite personalizar el promedio y el número de líneas de enlace. Esto aumenta la flexibilidad de la estrategia, y el usuario puede ajustar los parámetros para diferentes variedades.
Análisis de riesgos
Los principales riesgos de esta estrategia son:
Los sistemas de línea media no son sensibles a las señales de tipo cruz dorada. Si no hay una tendencia clara, la estrategia puede perder algunas oportunidades.
Una línea de red demasiado ancha puede aumentar el número de transacciones y el riesgo de deslizamiento. Una línea demasiado estrecha puede perderse en grandes casos. Encontrar el punto de equilibrio requiere una prueba adecuada.
En situaciones de crisis, la estrategia puede tener una mayor probabilidad de coincidencia. Por lo tanto, la selección de variedades con una tendencia evidente es mejor.
La fraccionamiento de las posiciones puede limitar los beneficios de cada una de ellas. Si solo se quiere asumir un riesgo unilateral, también se necesita una optimización adicional.
Dirección de optimización
La estrategia se puede optimizar principalmente en las siguientes direcciones:
Reemplazar otros indicadores para decidir sobre la construcción de un almacén y un almacén. Por ejemplo, el indicador KDJ, etc. o combinar varios indicadores para establecer condiciones de filtrado.
Aumentar la lógica de stop-loss. Esto puede bloquear parte de las ganancias y activamente evitar parte del riesgo.
Optimización de los parámetros para encontrar la mejor combinación de líneas medias y líneas de contorno. Esto requiere un buen retroceso y optimización para encontrar la mejor pareja de parámetros.
La combinación de tecnologías como el aprendizaje profundo permite la optimización inteligente de los parámetros. Los parámetros se aprenden y actualizan con el tiempo.
Tener en cuenta las diferencias de variedades y mercados, y establecer un conjunto de parámetros para adaptarse a diferentes entornos de negociación. Esto aumentará considerablemente la estabilidad de la estrategia.
Resumir
Esta estrategia de línea uniforme de paquete dinámico es muy adecuada para el comercio de tendencias en general. Es simple y eficiente, fácil de entender y optimizar. Como una estrategia básica, su plasticidad y escalabilidad son muy fuertes.
/*backtest
start: 2024-01-05 00:00:00
end: 2024-02-04 00:00:00
period: 1h
basePeriod: 15m
exchanges: [{"eid":"Futures_Binance","currency":"BTC_USDT"}]
*/

//@version=5
strategy("Envelope Strategy", overlay=true, default_qty_type=strategy.percent_of_equity, default_qty_value=100, initial_capital=1000, pyramiding = 5, commission_type=strategy.commission.percent, commission_value=0.0)

// CopyRight Crypto Robot

src = input(ohlc4, title="Source", group = "Base MA")
ma_base_window = input.int(5, "Base Mooving Average Window", step = 1, group = "Base MA")
ma_type = input.string(defval='1. SMA', options=['1. SMA', '2. PCMA', '3. EMA', '4. WMA', '5. DEMA', '6. ZLEMA', '7. HMA'], title='MA Type', group = "Base MA")


envelope_1_pct = input.float(0.05, "Envelope 1", step = 0.01, group = "Envelopes")
envelope_2_pct = input.float(0.10, "Envelope 2", step = 0.01, group = "Envelopes")
envelope_3_pct = input.float(0.15, "Envelope 3", step = 0.01, group = "Envelopes")
envelope_4_pct = input.float(0.0, "Envelope 4", step = 0.01, group = "Envelopes")
envelope_5_pct = input.float(0.0, "Envelope 5", step = 0.01, group = "Envelopes")

use_longs = input.bool(true, 'Long Positions')
use_short = input.bool(true, 'Short Positions')

total_envelope = 0
if envelope_1_pct > 0
    total_envelope := total_envelope + 1
if envelope_2_pct > 0
    total_envelope := total_envelope + 1
if envelope_3_pct > 0
    total_envelope := total_envelope + 1
if envelope_4_pct > 0
    total_envelope := total_envelope + 1
if envelope_5_pct > 0
    total_envelope := total_envelope + 1

// ---------------------------------------------
// -------------- INDICATORS -------------------
ma_function(MA_type, MA_length) =>
    zlema_lag = (MA_length - 1) / 2
    hma_src = MA_type == '7. HMA' ? 2 * ta.wma(src, math.floor(MA_length / 2)) - ta.wma(src, MA_length) : na
    MA_type == '1. SMA' ? ta.sma(src, MA_length) : MA_type == '2. PCMA' ? (ta.highest(high, MA_length) + ta.lowest(low, MA_length)) / 2 : MA_type == '3. EMA' ? ta.ema(src, MA_length) : MA_type == '4. WMA' ? ta.wma(src, MA_length) : MA_type == '5. DEMA' ? 2 * ta.ema(src, MA_length) - ta.ema(ta.ema(src, MA_length), MA_length) : MA_type == '6. ZLEMA' ? ta.ema(src + src - src[zlema_lag], MA_length) : MA_type == '7. HMA' ? ta.wma(hma_src, math.floor(math.sqrt(MA_length))) : na


ma_base = ma_function(ma_type, ma_base_window)

ma_high_1 = envelope_1_pct > 0 ? ma_base * (1 + envelope_1_pct) : na
ma_high_2 = envelope_2_pct > 0 ? ma_base * (1 + envelope_2_pct) : na
ma_high_3 = envelope_3_pct > 0 ? ma_base * (1 + envelope_3_pct) : na
ma_high_4 = envelope_4_pct > 0 ? ma_base * (1 + envelope_4_pct) : na
ma_high_5 = envelope_5_pct > 0 ? ma_base * (1 + envelope_5_pct) : na

ma_low_1 = envelope_1_pct > 0 ? ma_base * (1 - envelope_1_pct) : na
ma_low_2 = envelope_2_pct > 0 ? ma_base * (1 - envelope_2_pct) : na
ma_low_3 = envelope_3_pct > 0 ? ma_base * (1 - envelope_3_pct) : na
ma_low_4 = envelope_4_pct > 0 ? ma_base * (1 - envelope_4_pct) : na
ma_low_5 = envelope_5_pct > 0 ? ma_base * (1 - envelope_5_pct) : na

// ---------------------------------------------
// --------------- STRATEGY --------------------
if use_longs
    if envelope_1_pct > 0 and strategy.opentrades < 1
        strategy.entry('long 1', strategy.long, limit=ma_low_1, qty=(strategy.equity / ma_low_1) * (1 / total_envelope))
    if envelope_2_pct > 0 and strategy.opentrades < 2
        strategy.entry('long 2', strategy.long, limit=ma_low_2, qty=(strategy.equity / ma_low_2) * (1 / total_envelope))
    if envelope_3_pct > 0 and strategy.opentrades < 3
        strategy.entry('long 3', strategy.long, limit=ma_low_3, qty=(strategy.equity / ma_low_3) * (1 / total_envelope))
    if envelope_4_pct > 0 and strategy.opentrades < 4
        strategy.entry('long 4', strategy.long, limit=ma_low_4, qty=(strategy.equity / ma_low_4) * (1 / total_envelope))
    if envelope_5_pct > 0 and strategy.opentrades < 5
        strategy.entry('long 5', strategy.long, limit=ma_low_5, qty=(strategy.equity / ma_low_5) * (1 / total_envelope))


if use_short
    if envelope_1_pct > 0 and strategy.opentrades < 1
        strategy.entry('short 1', strategy.short, limit=ma_high_1, qty=(strategy.equity / ma_high_1) * (1 / total_envelope))
    if envelope_2_pct > 0 and strategy.opentrades < 2
        strategy.entry('short 2', strategy.short, limit=ma_high_2, qty=(strategy.equity / ma_high_2) * (1 / total_envelope))
    if envelope_3_pct > 0 and strategy.opentrades < 3
        strategy.entry('short 3', strategy.short, limit=ma_high_3, qty=(strategy.equity / ma_high_3) * (1 / total_envelope))
    if envelope_4_pct > 0 and strategy.opentrades < 4
        strategy.entry('short 4', strategy.short, limit=ma_high_4, qty=(strategy.equity / ma_high_4) * (1 / total_envelope))
    if envelope_5_pct > 0 and strategy.opentrades < 5
        strategy.entry('short 5', strategy.short, limit=ma_high_5, qty=(strategy.equity / ma_high_5) * (1 / total_envelope))


strategy.exit('close', limit=ma_base)


// ---------------------------------------------
// ------------------ PLOT ---------------------

ma_base_plot = plot(ma_base, title = "Base MA", color = color.orange, linewidth = 3, offset = 1)

ma_high_1_plot = plot(ma_high_1, title = "MA high 1", color = color.red, offset = 1)
ma_high_2_plot = plot(ma_high_2, title = "MA high 2", color = color.red, offset = 1)
ma_high_3_plot = plot(ma_high_3, title = "MA high 3", color = color.red, offset = 1)
ma_high_4_plot = plot(ma_high_4, title = "MA high 4", color = color.red, offset = 1)
ma_high_5_plot = plot(ma_high_5, title = "MA high 5", color = color.red, offset = 1)

ma_low_1_plot = plot(ma_low_1, title = "MA low 1", color = color.green, offset = 1)
ma_low_2_plot = plot(ma_low_2, title = "MA low 2", color = color.green, offset = 1)
ma_low_3_plot = plot(ma_low_3, title = "MA low 3", color = color.green, offset = 1)
ma_low_4_plot = plot(ma_low_4, title = "MA low 4", color = color.green, offset = 1)
ma_low_5_plot = plot(ma_low_5, title = "MA low 5", color = color.green, offset = 1)

plot(ohlc4, color=color.purple)

// use_period = input.bool(false, "Période spécifique ?", group="periode")
// startDate = input.time(timestamp("01 Jan 2020"), "Date de début", group="periode")
// endDate = input.time(timestamp("01 Jan 2025"), "Date de fin", group="periode")


//------------------------------------------
//-------------Indicateurs------------------

// inDateRange = use_period ? ((time >= startDate) and (time < endDate)) : true

// //--------------Backtest-------------------

// strategy_pnl = strategy.netprofit + strategy.openprofit
// bnh_strategy_pnl_pcnt = (strategy_pnl / strategy.initial_capital) * 100

// float bnh_start_bar = na
// bnh_start_bar := na(bnh_start_bar[1]) or inDateRange != true? close : bnh_start_bar[1]
// float bnl_buy_hold_equity = na
// bnl_buy_hold_equity :=  inDateRange == true ? ((close - bnh_start_bar)/bnh_start_bar) * 100 : bnl_buy_hold_equity[1]

// bnh_vs_diff = bnh_strategy_pnl_pcnt - bnl_buy_hold_equity
// bnh_diff_color = bnh_vs_diff > 0 ? color.new(color.green, inDateRange ? 60 : 100) : color.new(color.red, inDateRange ? 60 : 100)

// var Table = table.new(position.top_right, columns = 2, rows = 4, border_width = 1, bgcolor = color.black, border_color = color.gray)
// table.cell(table_id = Table, column = 0, row = 0, text_color=(bnh_strategy_pnl_pcnt>bnl_buy_hold_equity)?color.gray:color.green, text_size = size.normal, text = "Buy & hold profit")
// table.cell(table_id = Table, column = 1, row = 0, text_color=(bnh_strategy_pnl_pcnt>bnl_buy_hold_equity)?color.gray:color.green, text_size = size.normal, text = str.tostring(bnl_buy_hold_equity, '#.##') + ' %')
// table.cell(table_id = Table, column = 0, row = 1, text_color=(bnh_strategy_pnl_pcnt<bnl_buy_hold_equity)?color.gray:color.green, text_size = size.normal, text = "Strategy profit")
// table.cell(table_id = Table, column = 1, row = 1, text_color=(bnh_strategy_pnl_pcnt<bnl_buy_hold_equity)?color.gray:color.green, text_size = size.normal, text = str.tostring(bnh_strategy_pnl_pcnt, '#.##') + ' %')
// table.cell(table_id = Table, column = 0, row = 2, text_color=color.yellow, text_size = size.normal, text = "Date de début")
// table.cell(table_id = Table, column = 1, row = 2, text_color=color.yellow, text_size = size.normal, text = str.format("{0,date,dd-MM-YYYY}",strategy.closedtrades.entry_time(1)))