Estrategia de trailing stop loss de supertendencia basada en Heikin Ashi
Descripción general de la estrategia
La estrategia es una estrategia de seguimiento de tendencias que combina la línea de Heikin Ashi y el indicador de tendencias súper. Utiliza la línea de Heikin Ashi para filtrar el ruido del mercado, los indicadores de tendencias súper para determinar la dirección de la tendencia y el seguimiento de tendencias y el control de riesgos para lograr un seguimiento de tendencias y un control de riesgos eficientes con las tendencias súper dinámicas.
Principio de estrategia
- Calcula la línea de Heikin Ashi: incluye el precio de apertura, el precio de cierre, el precio más alto, el precio más bajo.
- Cálculo de los indicadores de tendencia súper: calculación de la subida y bajada de trenes en función del ATR y el precio.
- La combinación de las líneas de Heikin Ashi y las supertendencias determina la dirección de la tendencia.
- Una tendencia alcista es cuando el precio de cierre de Heikin Ashi está más cerca de la línea de cierre de la línea K anterior que la línea superior de la tendencia de la super tendencia; una tendencia bajista es cuando el precio de cierre de Heikin Ashi está más cerca de la línea de cierre de la línea K anterior que la línea inferior de la tendencia de la super tendencia
- En la tendencia alcista, el tren superior de la tendencia súper es la línea de seguimiento de la pérdida; en la tendencia bajista, el tren inferior de la tendencia súper es la línea de seguimiento de la pérdida.
Ventajas estratégicas
- El uso de filtros Heikin Ashi para detectar brechas falsas hace que las señales de tendencia sean más fiables.
- La supertrend actúa como un stop loss dinámico para bloquear al máximo los beneficios de la tendencia y evitar retroceder demasiado.
- La combinación de diferentes períodos de tiempo para juzgar el espacio libre, confirma la señal de alto bajo más confiable.
- La función de liquidación programada evita el efecto irracional de las acciones en un momento determinado.
Riesgo estratégico
- El riesgo de pérdidas se reduce con la relajación adecuada de la línea de pérdidas.
- La configuración incorrecta de los parámetros de la tendencia súper puede causar que el stop loss sea demasiado ancho o demasiado estrecho. Se pueden probar diferentes combinaciones de parámetros.
- No se consideran los problemas de administración de fondos. Se debe establecer un control de posición.
- No se tienen en cuenta los costos de las transacciones.
Dirección de optimización de la estrategia
- Optimización de la combinación de parámetros de la tendencia súper, para encontrar el parámetro óptimo.
- Se ha añadido la función de control de posición.
- Aumentar las consideraciones de costos, como las comisiones, los puntos de deslizamiento, etc.
- El stop loss puede ajustarse de forma flexible según la fuerza y la debilidad de la tendencia.
- Considere la posibilidad de filtrar las señales de entrada en combinación con otros indicadores.
Resumir
La estrategia integra las ventajas de los dos indicadores Heikin Ashi y Supertrend, para capturar la dirección de la tendencia y, al mismo tiempo, utilizar la supertrend para realizar un seguimiento dinámico automatizado de los paros, lo que bloquea las ganancias de la tendencia. El riesgo de la estrategia proviene principalmente de la reversión de la tendencia y la optimización de los parámetros, que pueden mejorarse mediante una optimización adicional. En general, la estrategia utiliza la integración de indicadores para mejorar la estabilidad y el espacio de ganancias del sistema de negociación.
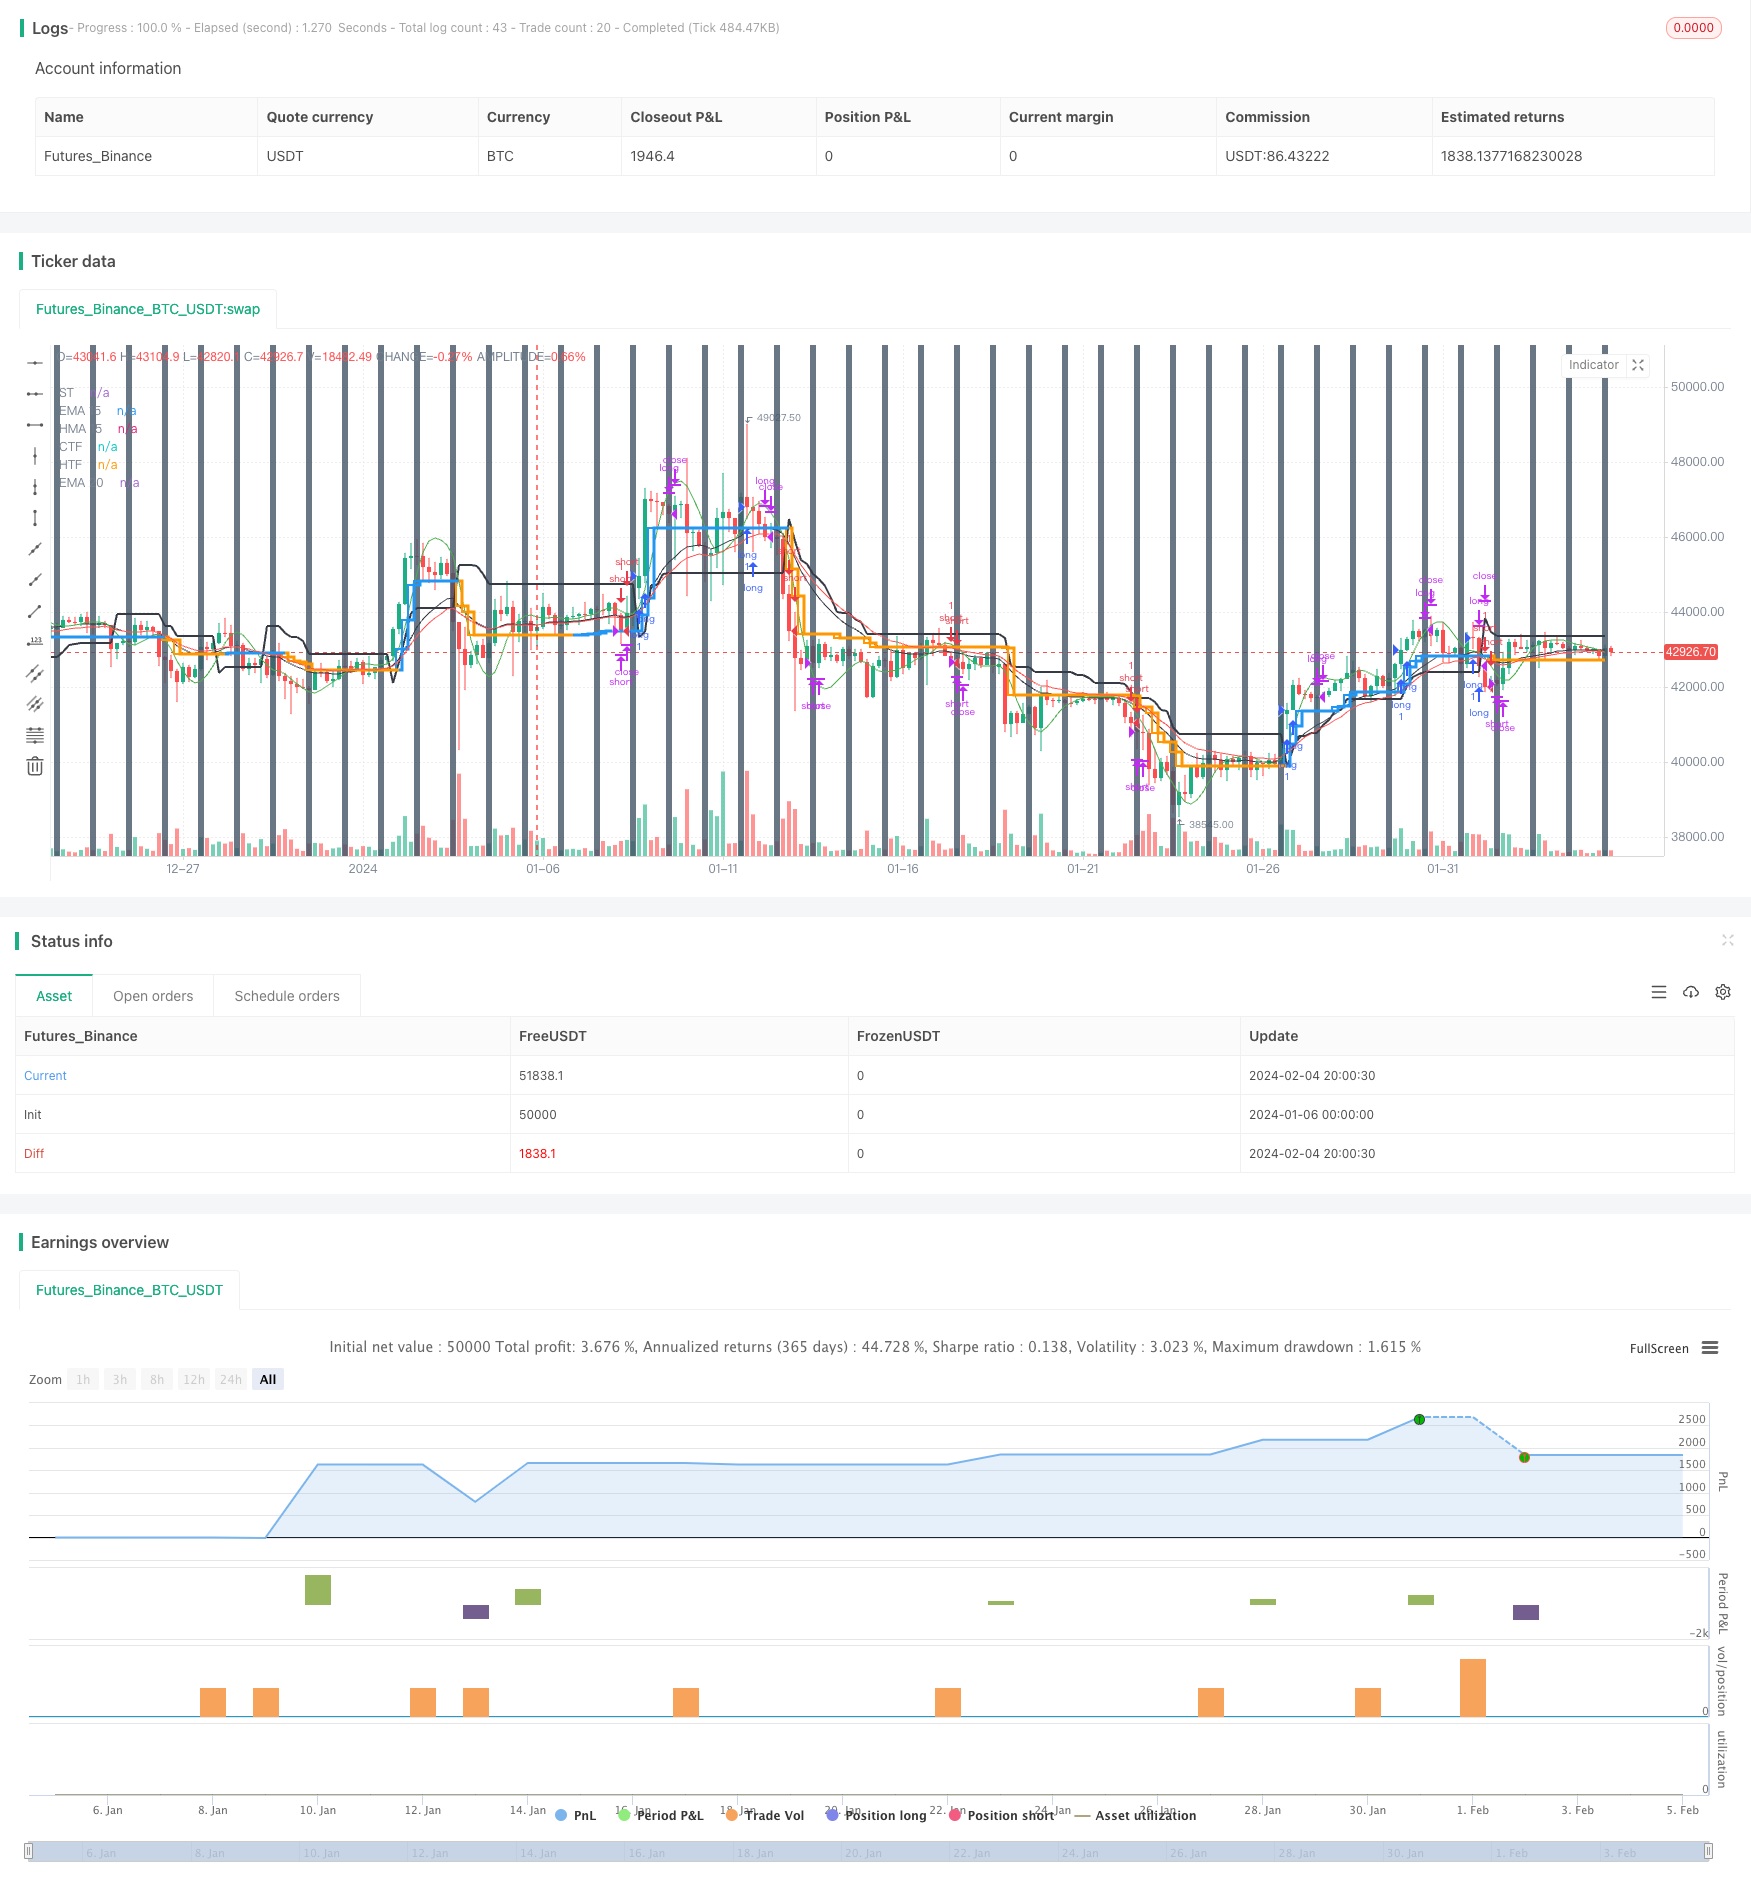
/*backtest
start: 2024-01-06 00:00:00
end: 2024-02-05 00:00:00
period: 4h
basePeriod: 15m
exchanges: [{"eid":"Futures_Binance","currency":"BTC_USDT"}]
*/

// This source code is subject to the terms of the Mozilla Public License 2.0 at https://mozilla.org/MPL/2.0/
// © ringashish

//@version=4
strategy("sa-strategy with HTF-TSL", overlay=true)


Pd = input(title="ATR Period", type=input.integer, defval=4)
Factor = input(title="ATR Multiplier", type=input.float, step=0.1, defval=2)
ST= supertrend(Factor, Pd)

heikinashi_close = security(heikinashi(syminfo.tickerid), timeframe.period, close)
heikinashi_low = security(heikinashi(syminfo.tickerid), timeframe.period, low)
heikinashi_open = security(heikinashi(syminfo.tickerid), timeframe.period, open)
heikinashi_high = security(heikinashi(syminfo.tickerid), timeframe.period, high)

heikinashi_close30 = security(heikinashi(syminfo.tickerid), "30", close)
//res1 = input("30", type=input.resolution, title="higher Timeframe")


//CCI TSL

res = input("240",type=input.resolution,title = "Higher Time Frame")
CCI = input(20)
ATR = input(5)
Multiplier=input(1,title='ATR Multiplier')
original=input(false,title='original coloring')
thisCCI = cci(close, CCI)
lastCCI = nz(thisCCI[1])


calcx()=>
    bufferDn= high + Multiplier * sma(tr,ATR)
    bufferUp= low - Multiplier * sma(tr,ATR)
    if (thisCCI >= 0 and lastCCI < 0)
        bufferUp := bufferDn[1]
    if (thisCCI <= 0 and lastCCI > 0)
        bufferDn := bufferUp[1]

    if (thisCCI >= 0)
        if (bufferUp < bufferUp[1])
            bufferUp := bufferUp[1]
    else
        if (thisCCI <= 0)
            if (bufferDn > bufferDn[1])
                bufferDn := bufferDn[1]


    x = 0.0
    x := thisCCI >= 0 ?bufferUp:thisCCI <= 0 ?bufferDn:x[1]
    x

tempx = calcx()

calcswap() =>
    swap = 0.0
    swap := tempx>tempx[1]?1:tempx<tempx[1]?-1:swap[1]
    swap

tempswap = calcswap()

swap2=tempswap==1?color.blue:color.orange
swap3=thisCCI >=0 ?color.blue:color.orange
swap4=original?swap3:swap2

//display current timeframe's Trend

plot(tempx,"CTF",color=swap4,transp=0,linewidth=2, style = plot.style_stepline)


htfx = security(syminfo.tickerid,res,tempx[1],lookahead = barmerge.lookahead_on)
htfswap4 = security(syminfo.tickerid,res,swap4[1],lookahead = barmerge.lookahead_on)

plot(htfx,"HTF",color=htfswap4,transp=0,linewidth=3,style = plot.style_stepline)


//supertrend
Supertrend(Factor, Pd) =>
    Up=hl2-(Factor*atr(Pd))
    Dn=hl2+(Factor*atr(Pd))

    TrendUp = 0.0
    TrendUp := heikinashi_close[1]>TrendUp[1] ? max(Up,TrendUp[1]) : Up
    TrendDown = 0.0
    TrendDown := heikinashi_close[1]<TrendDown[1]? min(Dn,TrendDown[1]) : Dn
    Trend = 0.0
    Trend := heikinashi_close > TrendDown[1] ? 1: heikinashi_close< TrendUp[1]? -1: nz(Trend[1],1)
    Tsl = Trend==1? TrendUp: TrendDown

    S_Buy = Trend == 1 ? 1 : 0
    S_Sell = Trend != 1 ? 1 : 0

    [Trend, Tsl]

[Trend,Tsl] = Supertrend(Factor, Pd)
// Security
//ST1_Trend_MTF = security(syminfo.tickerid, res1, Tsl,barmerge.lookahead_on)
//plot(ST1_Trend_MTF, "higher ST")

crossdn = crossunder(heikinashi_close,Tsl) or crossunder(heikinashi_close[1],Tsl) or crossunder(heikinashi_close[2],Tsl) or heikinashi_close < Tsl
crossup = crossover(heikinashi_close,Tsl) or crossover(heikinashi_close[1],Tsl) or crossover(heikinashi_close[2],Tsl) or heikinashi_close > Tsl
plot(Tsl,"ST",color = color.black,linewidth =2)
plot(ema(heikinashi_close,20),"EMA 20",color=color.red)
plot(hma(heikinashi_close,15),"HMA 15",color=color.green)
plot(ema(heikinashi_close,15),"EMA 15",color=color.black)

closedown = (heikinashi_close < hma(heikinashi_close,15) and heikinashi_high > hma(heikinashi_close,15)) or(heikinashi_close < ema(heikinashi_close,20) and heikinashi_high > ema(heikinashi_close,20))
closeup = (heikinashi_close > hma(heikinashi_close,15) and heikinashi_low < hma(heikinashi_close,15)) or (heikinashi_close > ema(heikinashi_close,20) and heikinashi_low < ema(heikinashi_close,20))

buy = heikinashi_open == heikinashi_low and closeup and crossup  and close > htfx
//buy = heikinashi_open == heikinashi_low and heikinashi_close > ema(close,20) and heikinashi_low < ema(close,20) and crossup
buyexit = cross(close,tempx) //heikinashi_open == heikinashi_high //and heikinashi_close < ema(close,15) and heikinashi_high > ema(close,15)

//if heikinashi_close30[1] < ST1_Trend_MTF
//sell = heikinashi_open == heikinashi_high and heikinashi_close < ema(close,20) and heikinashi_high > ema(close,20) and rsi(close,14)<60 and crossdn
sell = heikinashi_open == heikinashi_high and closedown and rsi(close,14)<55 and crossdn  and close < htfx
sellexit = cross(close,tempx) //heikinashi_open == heikinashi_low //and heikinashi_close > ema(close,15) and heikinashi_low < ema(close,15)

rg = 0
rg := buy ? 1 : buyexit ? 2 : nz(rg[1])

longLogic = rg != rg[1] and rg == 1
longExit = rg != rg[1] and rg == 2

//plotshape(longExit,"exit buy",style = shape.arrowup,location = location.belowbar,color = color.red, text ="buy exit", textcolor = color.red)
//plotshape(longLogic,"BUY",style = shape.arrowup,location = location.belowbar,color = color.green, text ="buy", textcolor= color.green)

nm = 0
nm := sell ? 1 : sellexit ? 2 : nz(nm[1])

shortLogic = nm != nm[1] and nm == 1
shortExit = nm != nm[1] and nm == 2

//plotshape(shortExit,"exit sell",style = shape.arrowup,location = location.belowbar,color = color.red, text ="sell exit", textcolor = color.red)
//plotshape(shortLogic,"SELL",style = shape.arrowup,location = location.belowbar,color = color.green, text ="sell", textcolor= color.green)


//Exit at particular time

ExitHour = input(title="Exit Hour Of Day", type=input.integer, defval=15, step = 5, maxval = 24, minval = 0)
ExitMint = input(title="Exit Minute Of Day", type=input.integer, defval=15, step = 5, maxval = 24, minval = 0)
bgc = input(title="Highlight Background Color?", type=input.bool, defval=true)
mRound(num,rem) => (floor(num/rem)*rem)
exitTime = (hour(time) >= ExitHour and (minute == mRound(ExitMint, timeframe.multiplier))) ? 1 : 0
exitTime := exitTime == 0 ? (hour(time) >= ExitHour and (minute + timeframe.multiplier >= ExitMint)) ? 1 : 0 : exitTime

MarketClose =  exitTime and not exitTime[1]

alertcondition(exitTime and not exitTime[1], title="Intraday Session Close Time", message="Close All Positions")
bgcolor(exitTime and not exitTime[1] and bgc ? #445566 : na, transp =40)


longCondition = longLogic
if (longCondition)
    strategy.entry("long", strategy.long)


shortCondition = shortLogic
if (shortCondition)
    strategy.entry("short", strategy.short)


strategy.close("short", when =cross(close,tempx)  or MarketClose)
strategy.close( "long", when =cross(close,tempx) or MarketClose )