
La estrategia utiliza el filtro Hodrick-Prescott, HP para suavizar el precio, extraer la línea de tendencia del precio. Luego, se calcula un precio medio ponderado personalizado basado en un intervalo de tiempo definido por el usuario.
El filtro HP extrae las líneas de tendencia del precio. El filtro HP extrae los componentes de tendencia a largo plazo del precio mediante métodos de optimización, eliminando las interferencias de fluctuación a corto plazo.
El VWAP se calcula en función de un rango de tiempo personalizado por el usuario. El VWAP refleja con mayor precisión el precio promedio en diferentes períodos.
Cuando el precio está por encima de la línea de tendencia de HP, se cumple la condición de hacer más; cuando el precio está por debajo de la línea de tendencia de HP, se cumple la condición de hacer menos. De esta manera, se puede capturar un avance de precios desde abajo o desde arriba hacia abajo.
La suspensión de pérdidas de ATR se combina con la asunción de riesgos razonables para evitar pérdidas excesivas.
El uso de filtros HP para extraer la tendencia de los precios es más suave en comparación con indicadores como el MA y evita ser engañado por las fluctuaciones de precios a corto plazo.
Clasificación del ciclo VWAP para una mayor flexibilidad en los cambios de ciclo del mercado.
El comercio de acuerdo con la dirección de la tendencia, en consonancia con la filosofía de comercio de tendencia, tiene una mayor probabilidad de ganar.
ATR para controlar las pérdidas individuales y evitar pérdidas excesivas.
Se puede ajustar el espacio de varios parámetros y optimizarlos para diferentes mercados.
En la clasificación de la placa de vibración, el stop loss puede ser golpeado con frecuencia. Se puede relajar el rango de stop loss adecuadamente.
ClientRawResponse al final de la tendencia a menudo presenta brechas de detección de reajuste que hacen que la estrategia se ajuste. Se debe combinar con otros indicadores para determinar el final de la tendencia y la liquidación oportuna.
Si el ciclo VWAP no está configurado correctamente, puede perderse una oportunidad de negociación más eficiente. Se debe ajustar el ciclo VWAP de acuerdo con la dinámica del indicador de tendencia.
El parámetro del filtro HP λ puede ajustar la intensidad del suavizado. La línea de tendencia de la hora grande es más suave y más favorable para capturar la tendencia de la línea larga; La hora de la hora de la hora es más sensible a los cambios en el precio y más adecuada para capturar oportunidades de la línea corta.
El multiplicador de ATR puede ajustar el rango de pérdidas. Puede ser compatible con la optimización de los parámetros de λ, y los valores de λ pueden ampliarse adecuadamente para ampliar el rango de pérdidas. Los valores de λ pueden reducirse para bloquear más ganancias.
El RR influye directamente en la tasa de ganancias y pérdidas. Se puede probar el control de retroceso y la rentabilidad en diferentes contextos multiplicativos.
La estrategia en su conjunto adopta el diseño de la idea de seguimiento de la tendencia. A través de varios parámetros de configuración se puede optimizar para diferentes períodos de tiempo, tanto largos como cortos, con una alta probabilidad de éxito y rentabilidad. También se ha tenido en cuenta el control de riesgos para garantizar que las pérdidas individuales no sean demasiado grandes. En general, la estrategia utiliza un método más científico para extraer las características de la tendencia de los precios, y luego combina las características de mayor espacio para optimizar los parámetros.
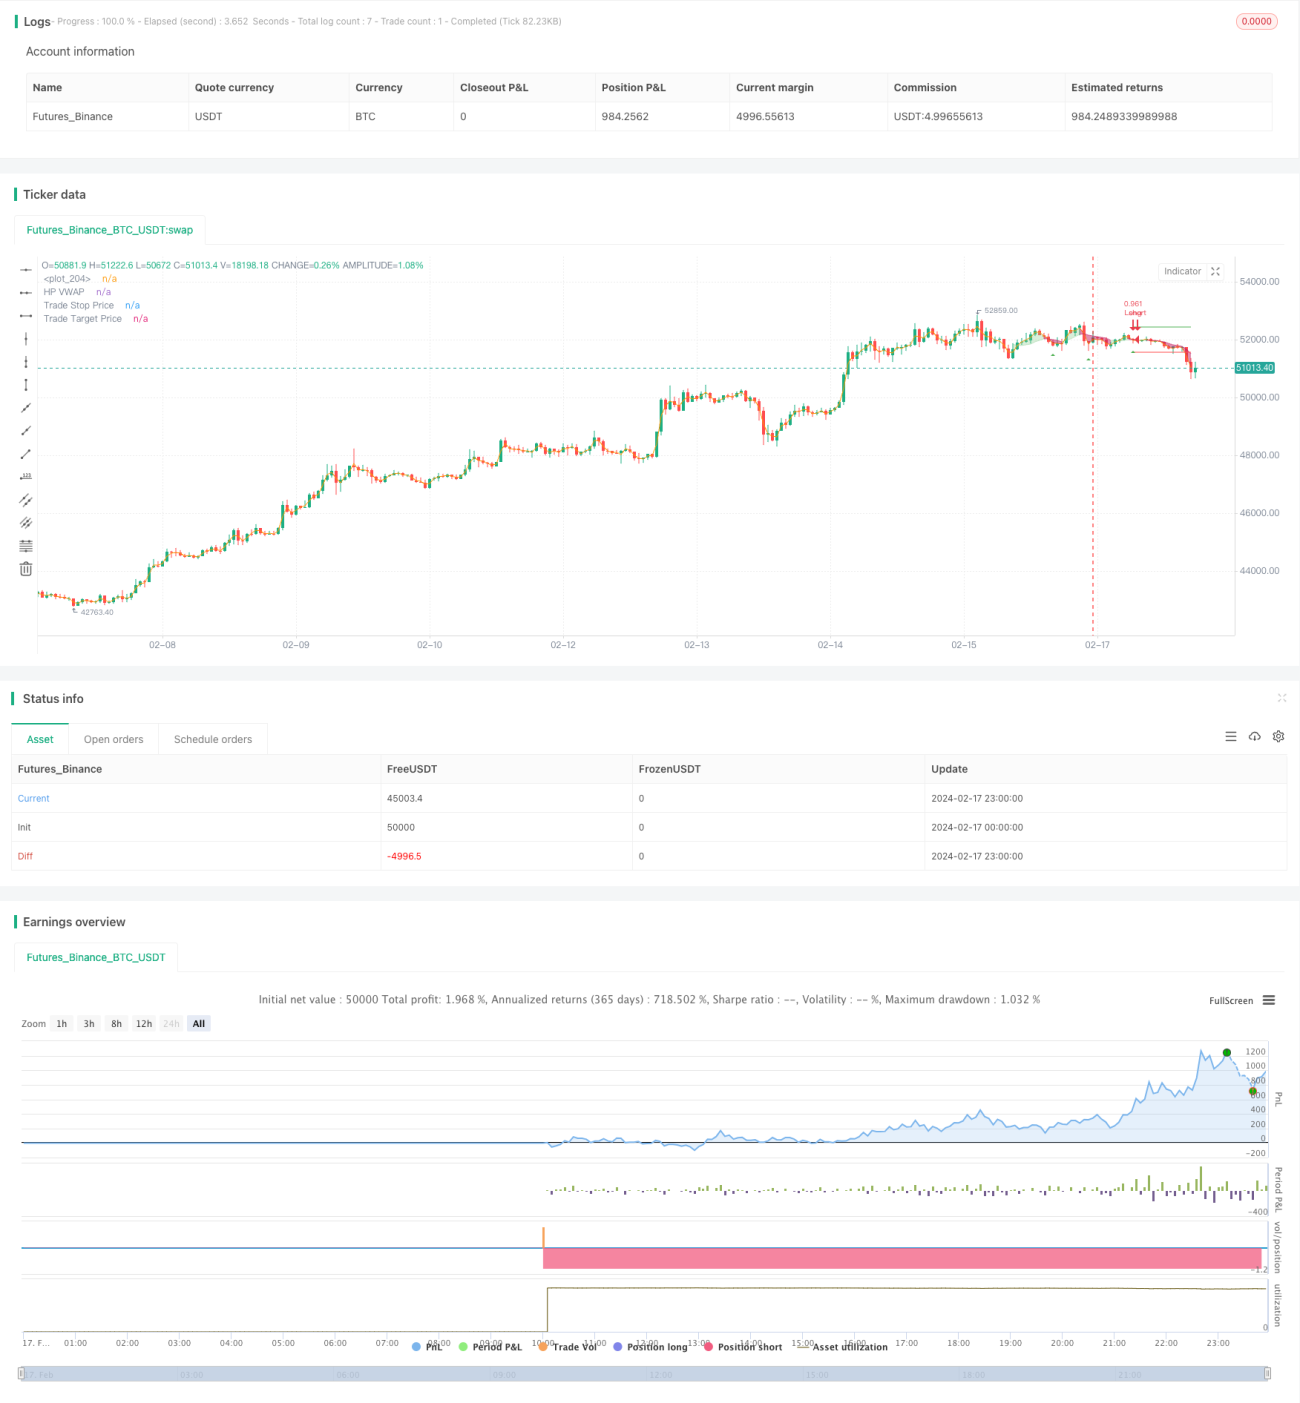
/*backtest
start: 2024-02-17 00:00:00
end: 2024-02-18 00:00:00
period: 1h
basePeriod: 15m
exchanges: [{"eid":"Futures_Binance","currency":"BTC_USDT"}]
*/
// This source code is subject to the terms of the Mozilla Public License 2.0 at https://mozilla.org/MPL/2.0/
// © tathal animouse hajixde
//@version=4
strategy("LPB MicroCycles Strategy", "HPVWAP", overlay=true, default_qty_type=strategy.percent_of_equity, default_qty_value=100, max_bars_back=5000)
startDate = input(title="Start Date", type=input.integer,
defval=1, minval=1, maxval=31)
startMonth = input(title="Start Month", type=input.integer,
defval=1, minval=1, maxval=12)
startYear = input(title="Start Year", type=input.integer,
defval=2010, minval=1800, maxval=2100)
endDate = input(title="End Date", type=input.integer,
defval=31, minval=1, maxval=31)
endMonth = input(title="End Month", type=input.integer,
defval=12, minval=1, maxval=12)
endYear = input(title="End Year", type=input.integer,
defval=2021, minval=1800, maxval=2100)
// STEP 2:
// Look if the close time of the current bar
// falls inside the date range
inDateRange = true
///
// Strategy Settings
var g_strategy = "Strategy Settings"
stopMultiplier = input(title="Stop Loss ATR", type=input.float, defval=1.0, group=g_strategy, tooltip="Stop loss multiplier (x ATR)")
rr = input(title="R:R", type=input.float, defval=1.0, group=g_strategy, tooltip="Risk:Reward profile")
/// Backtester Settings
var g_tester = "Backtester Settings"
startBalance = input(title="Starting Balance", type=input.float, defval=10000.0, group=g_tester, tooltip="Your starting balance for the custom inbuilt tester system")
riskPerTrade = input(title="Risk Per Trade", type=input.float, defval=1.0, group=g_tester, tooltip="Your desired % risk per trade (as a whole number)")
drawTester = input(title="Draw Backtester", type=input.bool, defval=true, group=g_tester, tooltip="Turn on/off inbuilt backtester display")
////////////////INPUTS///////////////////
lambda = input(defval = 1000, type = input.float, title = "Smoothing Factor (Lambda)", minval = 1)
leng = input(defval = 100, type = input.integer, title = "Filter Length", minval = 1)
src = ohlc4
atr = atr(14)
///////////Construct Arrays///////////////
a = array.new_float(leng, 0.0)
b = array.new_float(leng, 0.0)
c = array.new_float(leng, 0.0)
d = array.new_float(leng, 0.0)
e = array.new_float(leng, 0.0)
f = array.new_float(leng, 0.0)
/////////Initialize the Values///////////
ll1 = leng-1
ll2 = leng-2
for i = 0 to ll1
array.set(a,i, lambda*(-4))
array.set(b,i, src[i])
array.set(c,i, lambda*(-4))
array.set(d,i, lambda*6 + 1)
array.set(e,i, lambda)
array.set(f,i, lambda)
array.set(d, 0, lambda + 1.0)
array.set(d, ll1, lambda + 1.0)
array.set(d, 1, lambda * 5.0 + 1.0)
array.set(d, ll2, lambda * 5.0 + 1.0)
array.set(c, 0 , lambda * (-2.0))
array.set(c, ll2, lambda * (-2.0))
array.set(a, 0 , lambda * (-2.0))
array.set(a, ll2, lambda * (-2.0))
//////////////Solve the optimization issue/////////////////////
float r = array.get(a, 0)
float s = array.get(a, 1)
float t = array.get(e, 0)
float xmult = 0.0
for i = 1 to ll2
xmult := r / array.get(d, i-1)
array.set(d, i, array.get(d, i) - xmult * array.get(c, i-1))
array.set(c, i, array.get(c, i) - xmult * array.get(f, i-1))
array.set(b, i, array.get(b, i) - xmult * array.get(b, i-1))
xmult := t / array.get(d, i-1)
r := s - xmult*array.get(c, i-1)
array.set(d, i+1, array.get(d, i+1) - xmult * array.get(f, i-1))
array.set(b, i+1, array.get(b, i+1) - xmult * array.get(b, i-1))
s := array.get(a, i+1)
t := array.get(e, i)
xmult := r / array.get(d, ll2)
array.set(d, ll1, array.get(d, ll1) - xmult * array.get(c, ll2))
x = array.new_float(leng, 0)
array.set(x, ll1, (array.get(b, ll1) - xmult * array.get(b, ll2)) / array.get(d, ll1))
array.set(x, ll2, (array.get(b, ll2) - array.get(c, ll2) * array.get(x, ll1)) / array.get(d, ll2))
for j = 0 to leng-3
i = leng-3 - j
array.set(x, i, (array.get(b,i) - array.get(f,i)*array.get(x,i+2) - array.get(c,i)*array.get(x,i+1)) / array.get(d, i))
//////////////Construct the output///////////////////
HP = array.get(x,0)
///////////////Custom VWAP////////////////////////
TimeFrame = input('1', type=input.resolution)
start = security(syminfo.tickerid, TimeFrame, time)
//------------------------------------------------
newSession = iff(change(start), 1, 0)
//------------------------------------------------
vwapsum = 0.0
vwapsum := iff(newSession, HP*volume, vwapsum[1]+HP*volume)
volumesum = 0.0
volumesum := iff(newSession, volume, volumesum[1]+volume)
v2sum = 0.0
v2sum := iff(newSession, volume*HP*HP, v2sum[1]+volume*HP*HP)
myvwap = vwapsum/volumesum
dev = sqrt(max(v2sum/volumesum - myvwap*myvwap, 0))
Coloring=close>myvwap?color.new(#81c784, 62):color.new(#c2185b, 38)
av=myvwap
showBcol = input(true, type=input.bool, title="Show barcolors")
///////////////Entry & Exit///////////////////
// Custom function to convert pips into whole numbers
toWhole(number) =>
return = atr < 1.0 ? (number / syminfo.mintick) / (10 / syminfo.pointvalue) : number
return := atr >= 1.0 and atr < 100.0 and syminfo.currency == "JPY" ? return * 100 : return
// Custom function to convert whole numbers back into pips
toPips(number) =>
return = atr >= 1.0 ? number : (number * syminfo.mintick) * (10 / syminfo.pointvalue)
return := atr >= 1.0 and atr < 100.0 and syminfo.currency == "JPY" ? return / 100 : return
// Custom function to truncate (cut) excess decimal places
truncate(_number, _decimalPlaces) =>
_factor = pow(10, _decimalPlaces)
int(_number * _factor) / _factor
///////////////Conditional Strategy Logic//////////////
Long = crossover(av, ohlc4)
Sell = crossunder(av, ohlc4)
// Check if we have confirmation for our setup
validLong = Long and strategy.position_size == 0 and inDateRange and barstate.isconfirmed
validShort = Sell and strategy.position_size == 0 and inDateRange and barstate.isconfirmed
// Calculate our stop distance & size for the current bar
stopSize = atr * stopMultiplier
longStopPrice = low < low[1] ? low - stopSize : low[1] - stopSize
longStopDistance = close - longStopPrice
longTargetPrice = close + (longStopDistance * rr)
// Save trade stop & target & position size if a valid setup is detected
var t_entry = 0.0
var t_stop = 0.0
var t_target = 0.0
var t_direction = 0
// Detect valid long setups & trigger alert
if validLong
t_entry := close
t_stop := longStopPrice
t_target := longTargetPrice
t_direction := 1
strategy.entry(id="Long", long=strategy.long, when=validLong, comment="(SL=" + tostring(truncate(toWhole(longStopDistance),2)) + " pips)")
// Fire alerts
alert(message="Long Detected", freq=alert.freq_once_per_bar_close)
// Check if price has hit long stop loss or target
if t_direction == 1 and (low <= t_stop or high >= t_target)
t_direction := 0
// Check if price has hit short stop loss or target
if t_direction == -1 and (high >= t_stop or low <= t_target)
t_direction := 0
// Exit trades whenever our stop or target is hit
strategy.exit(id="Long Exit", from_entry="Long", limit=t_target, stop=t_stop, when=strategy.position_size > 0)
// Draw trade data
plot(strategy.position_size != 0 or validLong? t_stop : na, title="Trade Stop Price", color=color.red, style=plot.style_linebr)
plot(strategy.position_size != 0 or validLong? t_target : na, title="Trade Target Price", color=color.green, style=plot.style_linebr)
/////////////////////Plotting//////////////////////////
A=plot(av, color=Coloring, title="HP VWAP")
barcolor(showBcol?Coloring:na)
fill(A, plot(ohlc4), Coloring)
// Draw price action setup arrows
plotshape(validLong ? 1 : na, style=shape.triangleup, location=location.belowbar, color=color.green, title="Bullish Setup")
// // --- BEGIN TESTER CODE --- //
// // Declare performance tracking variables
// var balance = startBalance
// var drawdown = 0.0
// var maxDrawdown = 0.0
// var maxBalance = 0.0
// var totalPips = 0.0
// var totalWins = 0
// var totalLoss = 0
// // Detect winning trades
// if strategy.wintrades != strategy.wintrades[1]
// balance := balance + ((riskPerTrade / 100) * balance) * rr
// totalPips := totalPips + abs(t_entry - t_target)
// totalWins := totalWins + 1
// if balance > maxBalance
// maxBalance := balance
// // Detect losing trades
// if strategy.losstrades != strategy.losstrades[1]
// balance := balance - ((riskPerTrade / 100) * balance)
// totalPips := totalPips - abs(t_entry - t_stop)
// totalLoss := totalLoss + 1
// // Update drawdown
// drawdown := (balance / maxBalance) - 1
// if drawdown < maxDrawdown
// maxDrawdown := drawdown
// // Prepare stats table
// var table testTable = table.new(position.top_right, 5, 2, border_width=1)
// f_fillCell(_table, _column, _row, _title, _value, _bgcolor, _txtcolor) =>
// _cellText = _title + "\n" + _value
// table.cell(_table, _column, _row, _cellText, bgcolor=_bgcolor, text_color=_txtcolor)
// // Draw stats table
// var bgcolor = color.new(color.black,0)
// if drawTester
// if barstate.islastconfirmedhistory
// // Update table
// dollarReturn = balance - startBalance
// f_fillCell(testTable, 0, 0, "Total Trades:", tostring(strategy.closedtrades), bgcolor, color.white)
// f_fillCell(testTable, 0, 1, "Win Rate:", tostring(truncate((strategy.wintrades/strategy.closedtrades)*100,2)) + "%", bgcolor, color.white)
// f_fillCell(testTable, 1, 0, "Starting:", "$" + tostring(startBalance), bgcolor, color.white)
// f_fillCell(testTable, 1, 1, "Ending:", "$" + tostring(truncate(balance,2)), bgcolor, color.white)
// f_fillCell(testTable, 2, 0, "Return:", "$" + tostring(truncate(dollarReturn,2)), dollarReturn > 0 ? color.green : color.red, color.white)
// f_fillCell(testTable, 2, 1, "Pips:", (totalPips > 0 ? "+" : "") + tostring(truncate(toWhole(totalPips),2)), bgcolor, color.white)
// f_fillCell(testTable, 3, 0, "Return:", (dollarReturn > 0 ? "+" : "") + tostring(truncate((dollarReturn / startBalance)*100,2)) + "%", dollarReturn > 0 ? color.green : color.red, color.white)
// f_fillCell(testTable, 3, 1, "Max DD:", tostring(truncate(maxDrawdown*100,2)) + "%", color.red, color.white)
// // --- END TESTER CODE --- //