Estrategia de ruptura basada en el impulso

Descripción general
La estrategia de ruptura dinámica es una estrategia de tendencia que sigue la dinámica del mercado. Combina varios indicadores para determinar si el mercado está actualmente en una tendencia ascendente o descendente, y toma más posiciones al romper los puntos críticos de resistencia, y toma posiciones vacías al romper los puntos críticos de soporte.
Principio de estrategia
La estrategia determina la tendencia del mercado y los precios clave mediante el cálculo de varios canales donchianos de largos períodos. En concreto, determina una tendencia alcista cuando el precio supera un ciclo más largo, como el de 40 días, y en esa base emite múltiples señales combinadas con condiciones de filtración, como nuevos altibajos en el año y una alineación direccional de la media móvil.
En cuanto a la salida de posiciones, la estrategia ofrece dos opciones: la línea de cancelación fija y el stop tracking. La línea de cancelación fija establece el stop en función de un período más corto, como el canal Donchian de 20 días; el stop tracking calcula el stop tracking diariamente en función del valor de ATR. Ambos métodos de stop tracking controlan el riesgo de manera eficiente.
Análisis de las ventajas
Esta estrategia combina el juicio de la tendencia y la operación de la ruptura, capaz de capturar eficazmente las oportunidades direccionales de las líneas cortas en el mercado. En comparación con un solo indicador, que utiliza una amplia gama de condiciones de filtración, que puede filtrar algunos falsos brechas para mejorar la calidad de la señal de entrada. Además, la aplicación de la estrategia de detener los pérdidas también hace que sea más resistente, incluso si la situación de corto plazo de retroceso puede controlar eficazmente las pérdidas.
Análisis de riesgos
El principal riesgo de esta estrategia reside en la posibilidad de que se produzcan fuertes fluctuaciones en el mercado, lo que provoca que el stop loss sea el desencadenante de la salida de la posición. En este caso, si el mercado se invierte rápidamente, es posible que se pierda la oportunidad. Además, la aplicación de múltiples condiciones de filtración también filtra algunas oportunidades y reduce la frecuencia de la estrategia.
Para reducir el riesgo, se puede ajustar adecuadamente el valor de ATR o ampliar el intervalo de órbita Donchian, lo que reduce la posibilidad de que el stop-loss sea superado. También se pueden reducir o cancelar algunas condiciones de filtración para aumentar la frecuencia de entrada, pero el riesgo también aumenta.
Dirección de optimización
La estrategia puede ser optimizada en los siguientes aspectos:
- Optimización de la longitud de los canales Donchianos para buscar la combinación óptima de parámetros
- Intentar diferentes tipos de medias móviles como indicadores de fluctuación
- Ajuste el ATR multiplicado o cambiado a un número fijo de puntos de parada
- Añadir más indicadores de tendencia, como el MACD
- Optimizar las ventanas de juicio de los altos y bajos durante el año, etc.
A través de la prueba de diferentes parámetros, se puede encontrar la combinación óptima de parámetros, logrando un equilibrio entre riesgos y beneficios.
Resumir
La estrategia utiliza una combinación de varios indicadores para determinar la dirección de la tendencia y emite una señal de negociación cuando se rompe un punto crítico. Su mecanismo de stop loss también hace que la estrategia tenga una mayor capacidad de control de riesgos. Mediante la configuración de parámetros optimizados, la estrategia puede lograr un beneficio adicional estable.
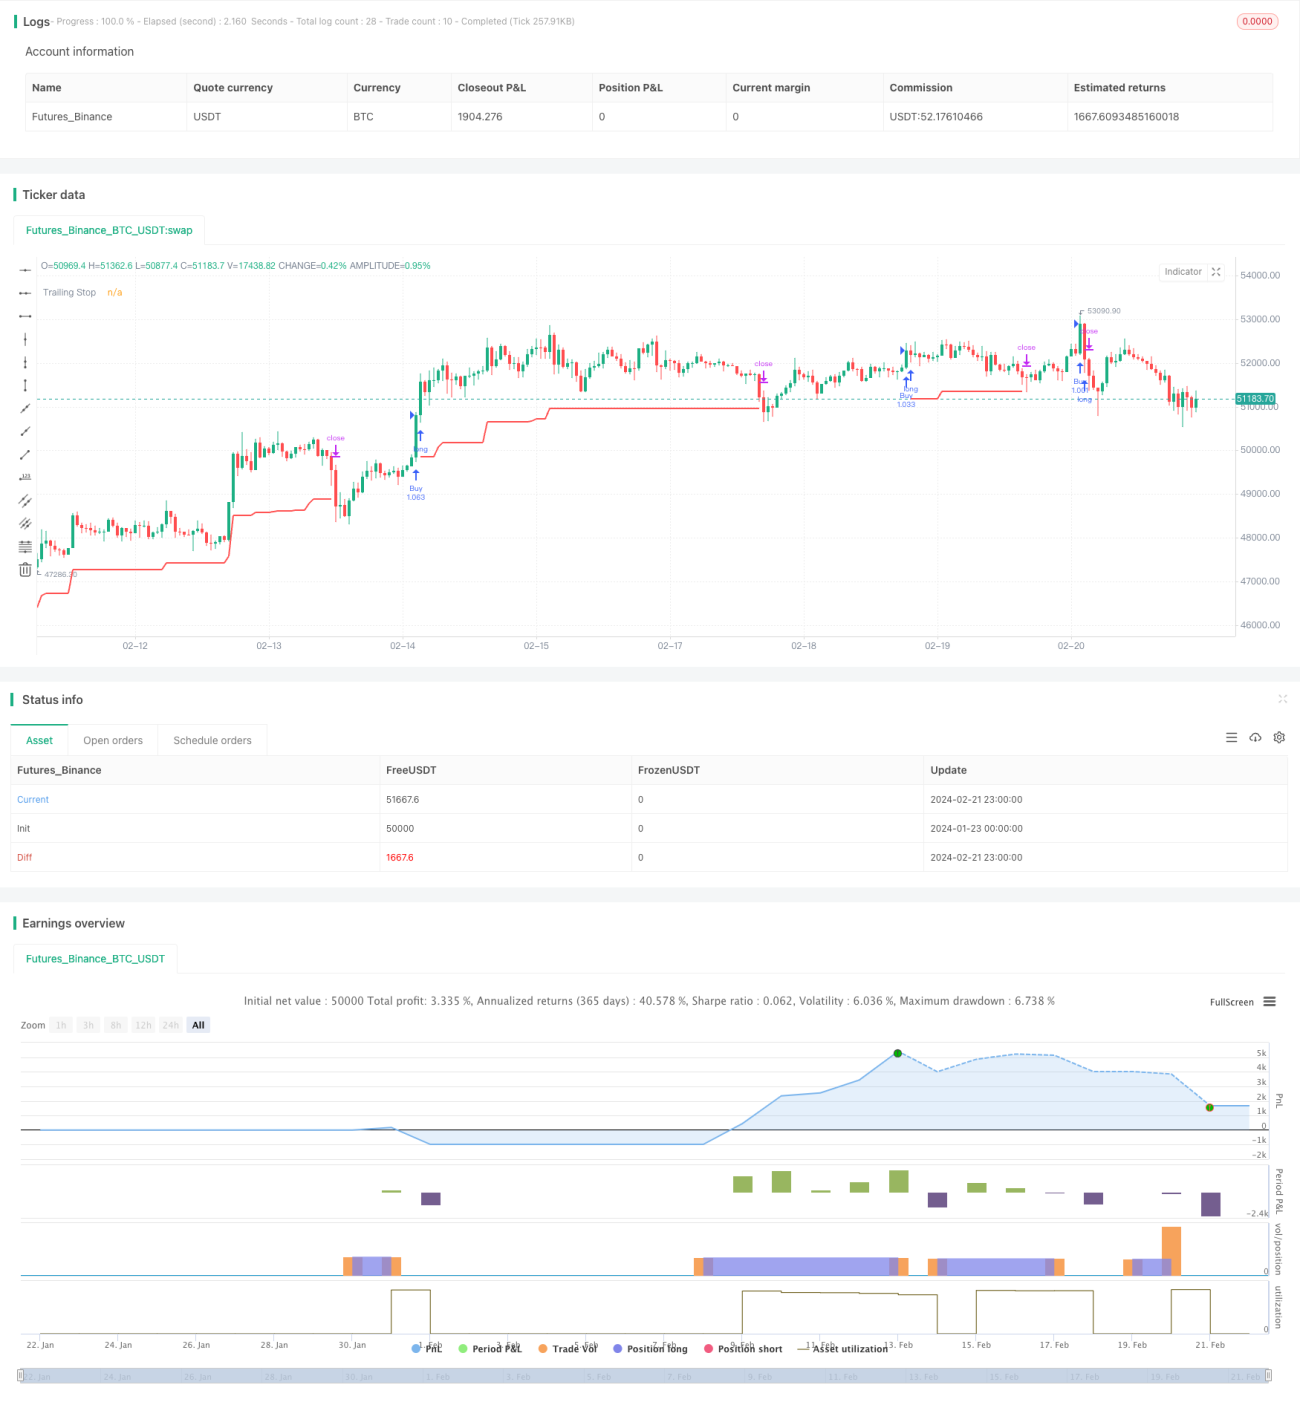
/*backtest
start: 2024-01-23 00:00:00
end: 2024-02-22 00:00:00
period: 1h
basePeriod: 15m
exchanges: [{"eid":"Futures_Binance","currency":"BTC_USDT"}]
*/

// This source code is subject to the terms of the Mozilla Public License 2.0 at https://mozilla.org/MPL/2.0/
// © HeWhoMustNotBeNamed

//@version=4- 1