Stratégie de trading bidirectionnelle avec écart entre moyennes mobiles multiples

Aperçu
Cette stratégie utilise l'indicateur Williams New High New Low pour identifier les signaux de retournement de la hausse et de la baisse de la hausse, et pour effectuer des transactions de fissure avec la ligne de la moyenne multiple, en plus de filtrer les faux signaux avec l'indicateur RSI, pour réaliser des transactions bidirectionnelles efficaces.
Principe de stratégie
-
L'indicateur Williams New High New Low utilise les prix les plus élevés et les prix les plus bas d'une période donnée pour déterminer les points de basculement et émettre des signaux d'achat et de vente.
-
Les courbes de 20, 50 et 100 jours constituent les courbes de multiples courbes, qui émettent un signal de transaction lorsque le prix franchit deux de ces courbes.
-
L'indicateur RSI détermine les zones de sur-achat et de sur-vente et est utilisé pour filtrer les signaux d'incertitude.
-
La stratégie consiste à déterminer quelles lignes sont franchies par le prix, en combinant les signaux de l'indicateur Williams et le filtrage RSI pour produire un signal d'achat et de vente stable.
-
Jugement d'entrée: Faire plus lorsque la moyenne courte période franchit la moyenne longue période de bas en haut et que les signaux de nouveau bas de Williams et de bas RSI apparaissent simultanément; Faire plus lorsque la moyenne courte période franchit la moyenne longue période de haut en bas et que les signaux de nouveau haut de Williams et de haut RSI apparaissent simultanément.
-
Arrêt de perte: arrêt de perte à proportion fixe.
Avantages stratégiques
-
L'indicateur Williams permet de déterminer avec précision les résistances de soutien et de reconnaître les signaux de renversement.
-
Le jugement de rupture de la moyenne multiple évite les signaux erronés causés par une seule oscillation de la moyenne.
-
L'indicateur RSI aide à filtrer les faux signaux, ce qui rend le timing d'entrée plus précis et plus fiable.
-
Le système d'arrêt des pertes fixe permet de contrôler les risques et de clarifier les profits et pertes.
-
La double confirmation des indicateurs de retournement et de tendance rend les signaux de négociation plus précis et plus fiables.
Risque stratégique
-
Le choix des variétés commerciales est incorrect, les paramètres des différentes variétés doivent être ajustés.
-
Le choix de la période n'est pas raisonnable, il faut ajuster les paramètres pour les différentes périodes.
-
Le stop-loss fixe ne peut pas être ajusté en fonction des variations du marché et peut être arrêté trop tôt ou insuffisamment.
-
Les ondes de la ligne moyenne sont susceptibles de produire des signaux erronés.
-
L'indicateur émet un signal de retard lors de la dispersion.
Orientation de l'optimisation de la stratégie
-
Paramètres d'optimisation dynamique en fonction des différentes variétés de transactions.
-
L'ajout d'un système d'arrêt automatique des pertes pour rendre les pertes plus raisonnables.
-
Ajout de filtres sur d'autres indicateurs comme le MACD, le stochastique et d'autres pour réduire les signaux erronés.
-
L'ajout d'algorithmes d'apprentissage automatique pour identifier automatiquement le meilleur moment de la transaction.
-
Les tendances sont identifiées par un ensemble d'indicateurs de tendances.
Résumer
Cette stratégie utilise un ensemble d'outils d'analyse technique tels que l'indicateur Williams, l'indicateur de la moyenne et l'indicateur RSI. Elle réduit les signaux erronés grâce à la double confirmation, permet de capturer efficacement les occasions de revers et est associée à un contrôle du risque de stop loss fixe.
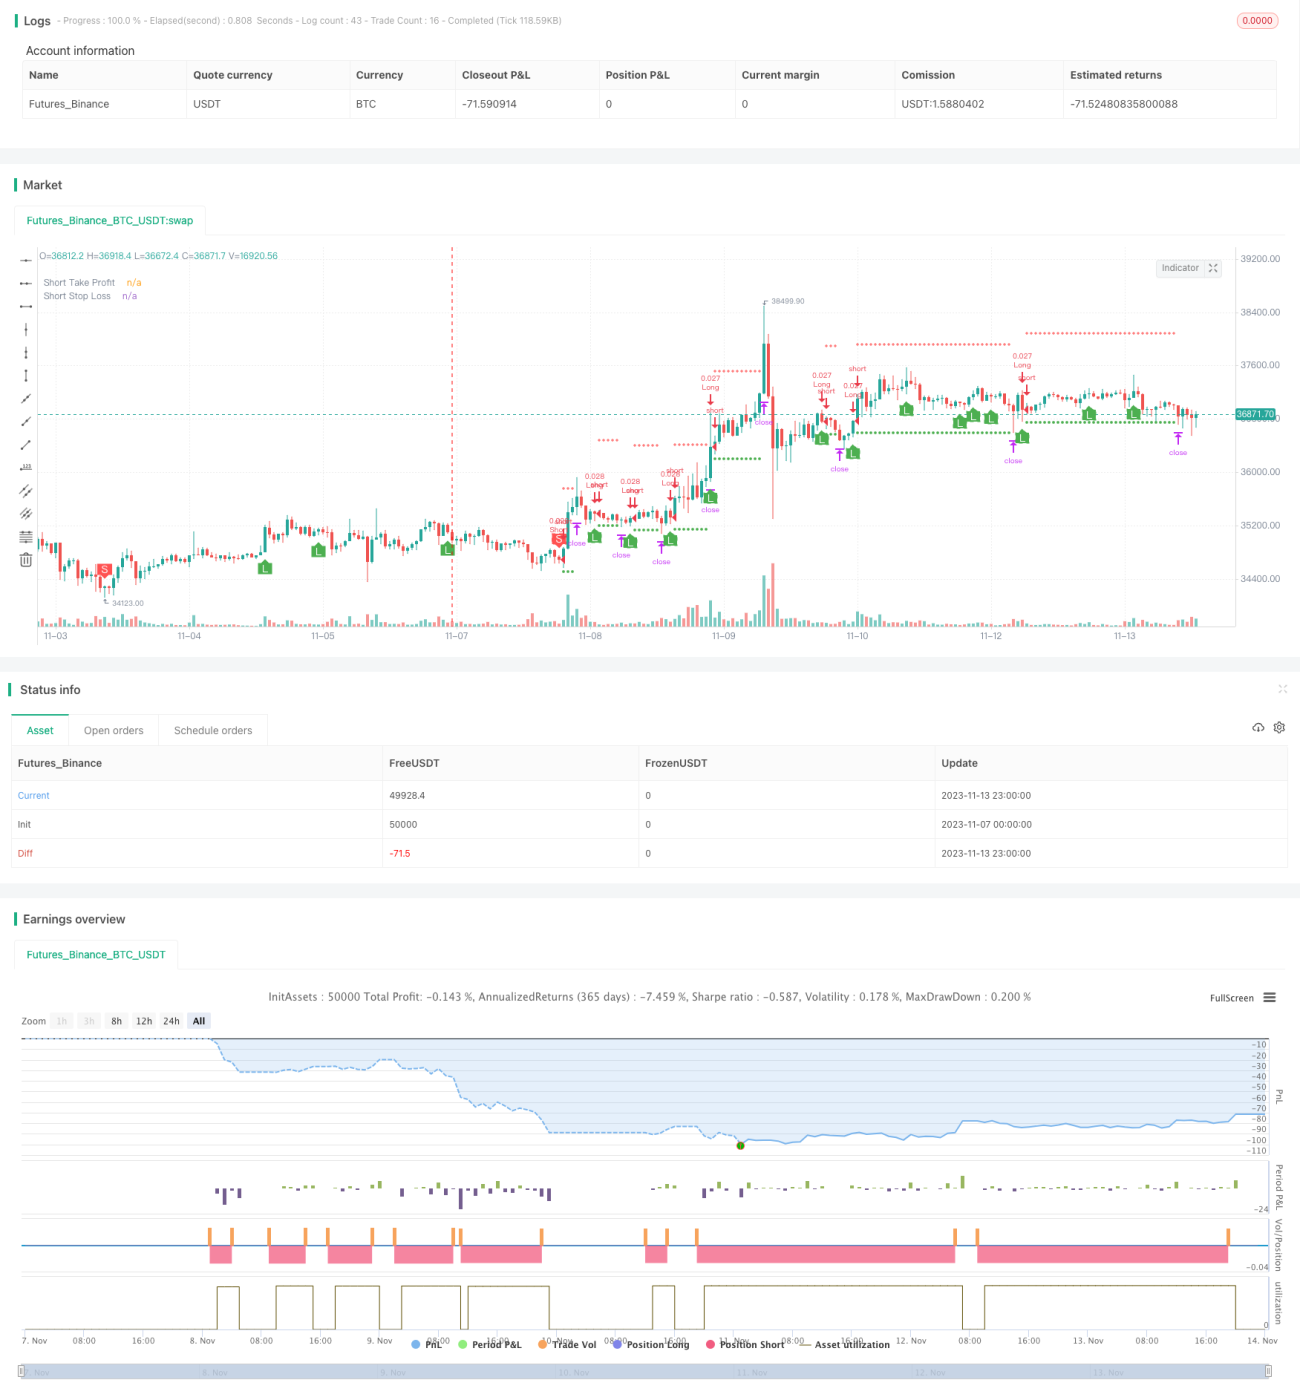
/*backtest
start: 2023-11-07 00:00:00
end: 2023-11-14 00:00:00
period: 1h
basePeriod: 15m
exchanges: [{"eid":"Futures_Binance","currency":"BTC_USDT"}]
*/

// This source code is subject to the terms of the Mozilla Public License 2.0 at https://mozilla.org/MPL/2.0/
// © B_L_A_C_K_S_C_O_R_P_I_O_N
// v 1.1
- 1