
Cette stratégie est une stratégie de trading quantitative qui utilise les indicateurs RSI et T3 pour juger de la tendance et, en combinaison avec les indicateurs ATR, définir une ligne de stop-loss, pour réaliser un PMax adapté à la rupture. Son idée principale est d’optimiser le jugement de la tendance et les paramètres de stop-loss pour contrôler le risque tout en augmentant la rentabilité.
Calculer le RSI et le T3 pour déterminer la tendance
PMax est réglé en fonction de l’indicateur ATR
Achat et sortie à perte
Les principaux avantages de cette stratégie sont les suivants:
La stratégie présente principalement les risques suivants:
Lorsqu’une inversion de prix se produit dans un court laps de temps, cela peut entraîner une perte de stop-loss. La ligne de stop-loss peut être relâchée de manière appropriée pour réduire l’impact de la inversion.
Les indicateurs RSI et T3 ne sont pas fiables à 100% pour déterminer les tendances et peuvent entraîner des pertes en cas d’erreur de jugement. Les paramètres peuvent être ajustés de manière appropriée ou ajoutés à d’autres indicateurs pour optimiser.
Cette stratégie peut être optimisée dans les domaines suivants:
Cette stratégie intègre les avantages de l’utilisation des trois indicateurs RSI, T3 et ATR, permettant une combinaison organique de jugement de tendance et de contrôle du risque. Par rapport à un seul indicateur, la combinaison présente des caractéristiques de haute précision de jugement et de contrôle du retrait, ce qui en fait une stratégie de suivi de tendance fiable. Il y a de la place pour l’optimisation des paramètres et du contrôle du risque, ce qui en fait une stratégie de trading quantitative recommandée dans l’ensemble.
/*backtest
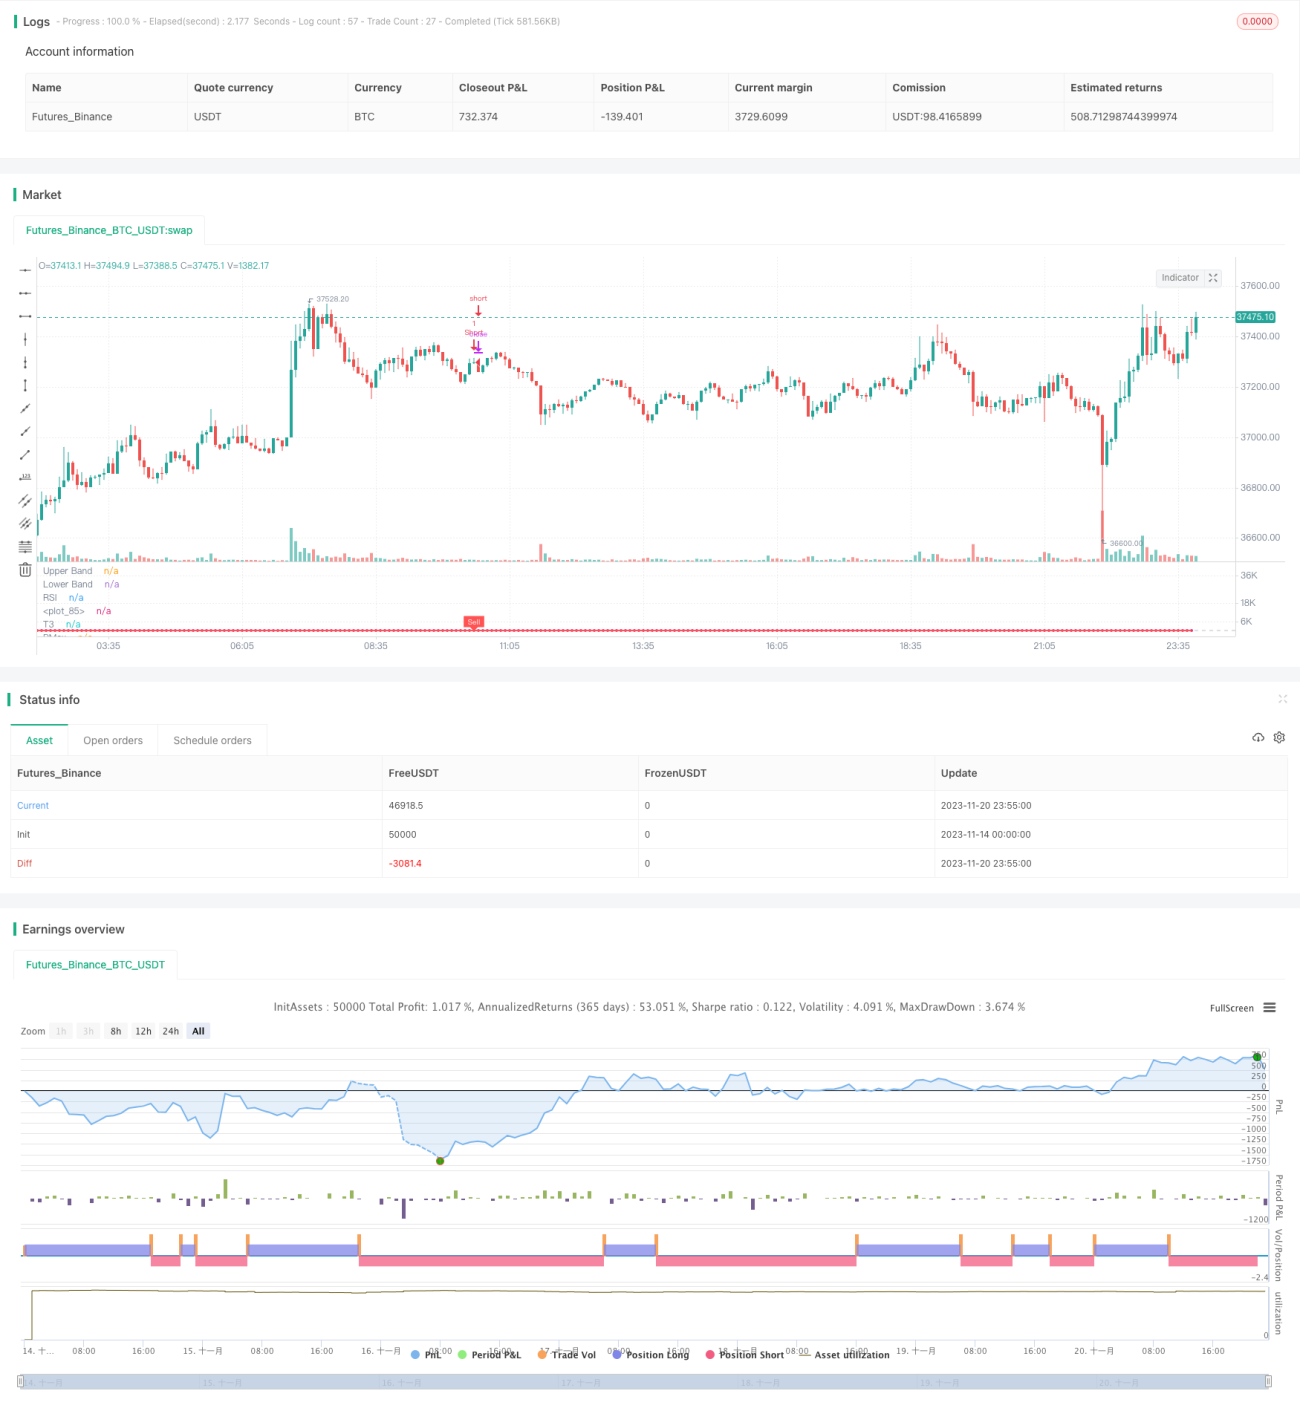
start: 2023-11-14 00:00:00
end: 2023-11-21 00:00:00
period: 5m
basePeriod: 1m
exchanges: [{"eid":"Futures_Binance","currency":"BTC_USDT"}]
*/
//@version=4
// This source code is subject to the terms of the Mozilla Public License 2.0 at https://mozilla.org/MPL/2.0/
// © KivancOzbilgic
//developer: @KivancOzbilgic
//author: @KivancOzbilgic
strategy("PMax on Rsi w T3 Strategy","PmR3St.", overlay=false, precision=2)
src = input(hl2, title="Source")
Multiplier = input(title="ATR Multiplier", type=input.float, step=0.1, defval=3)
length =input(8, "Tillson T3 Length", minval=1)
T3a1 = input(0.7, "TILLSON T3 Volume Factor", step=0.1)
Periods = input(10,title="ATR Length", type=input.integer)
rsilength = input(14, minval=1, title="RSI Length")
showrsi = input(title="Show RSI?", type=input.bool, defval=true)
showsupport = input(title="Show Moving Average?", type=input.bool, defval=true)
showsignalsk = input(title="Show Crossing Signals?", type=input.bool, defval=true)
highlighting = input(title="Highlighter On/Off ?", type=input.bool, defval=true)
i = close>=close[1] ? close-close[1] : 0
i2 = close<close[1] ? close[1]-close : 0
Wwma_Func(src,rsilength)=>
wwalpha = 1/ rsilength
WWMA = 0.0
WWMA := wwalpha*src + (1-wwalpha)*nz(WWMA[1])
WWMA=Wwma_Func(src,rsilength)
AvUp = Wwma_Func(i,rsilength)
AvDown = Wwma_Func(i2,rsilength)
AvgUp = sma(i,rsilength)
AvgDown =sma(i2,rsilength)
k1 = high>close[1] ? high-close[1] : 0
k2 = high<close[1] ? close[1]-high : 0
k3 = low>close[1] ? low-close[1] : 0
k4 = low<close[1] ? close[1]-low : 0
AvgUpH=(AvgUp*(rsilength-1)+ k1)/rsilength
AvgDownH=(AvgDown*(rsilength-1)+ k2)/rsilength
AvgUpL=(AvgUp*(rsilength-1)+ k3)/rsilength
AvgDownL=(AvgDown*(rsilength-1)+ k4)/rsilength
rs = AvUp/AvDown
rsi= rs==-1 ? 0 : (100-(100/(1+rs)))
rsh=AvgUpH/AvgDownH
rsih= rsh==-1 ? 0 : (100-(100/(1+rsh)))
rsl=AvgUpL/AvgDownL
rsil= rsl==-1 ? 0 : (100-(100/(1+rsl)))
TR=max(rsih-rsil,abs(rsih-rsi[1]),abs(rsil-rsi[1]))
atr=sma(TR,Periods)
plot(showrsi ? rsi : na, "RSI", color=#8E1599)
band1 = hline(70, "Upper Band", color=#C0C0C0)
band0 = hline(30, "Lower Band", color=#C0C0C0)
fill(band1, band0, color=#9915FF, transp=90, title="Background")
T3e1=ema(rsi, length)
T3e2=ema(T3e1,length)
T3e3=ema(T3e2,length)
T3e4=ema(T3e3,length)
T3e5=ema(T3e4,length)
T3e6=ema(T3e5,length)
T3c1=-T3a1*T3a1*T3a1
T3c2=3*T3a1*T3a1+3*T3a1*T3a1*T3a1
T3c3=-6*T3a1*T3a1-3*T3a1-3*T3a1*T3a1*T3a1
T3c4=1+3*T3a1+T3a1*T3a1*T3a1+3*T3a1*T3a1
T3=T3c1*T3e6+T3c2*T3e5+T3c3*T3e4+T3c4*T3e3
MAvg=T3
Pmax_Func(rsi,length)=>
longStop = MAvg - Multiplier*atr
longStopPrev = nz(longStop[1], longStop)
longStop := MAvg > longStopPrev ? max(longStop, longStopPrev) : longStop
shortStop = MAvg + Multiplier*atr
shortStopPrev = nz(shortStop[1], shortStop)
shortStop := MAvg < shortStopPrev ? min(shortStop, shortStopPrev) : shortStop
dir = 1
dir := nz(dir[1], dir)
dir := dir == -1 and MAvg > shortStopPrev ? 1 : dir == 1 and MAvg < longStopPrev ? -1 : dir
PMax = dir==1 ? longStop: shortStop
PMax=Pmax_Func(rsi,length)
plot(showsupport ? MAvg : na, color=color.black, linewidth=2, title="T3")
pALL=plot(PMax, color=color.red, linewidth=2, title="PMax", transp=0)
alertcondition(cross(MAvg, PMax), title="Cross Alert", message="PMax - Moving Avg Crossing!")
alertcondition(crossover(MAvg, PMax), title="Crossover Alarm", message="Moving Avg BUY SIGNAL!")
alertcondition(crossunder(MAvg, PMax), title="Crossunder Alarm", message="Moving Avg SELL SIGNAL!")
alertcondition(cross(src, PMax), title="Price Cross Alert", message="PMax - Price Crossing!")
alertcondition(crossover(src, PMax), title="Price Crossover Alarm", message="PRICE OVER PMax - BUY SIGNAL!")
alertcondition(crossunder(src, PMax), title="Price Crossunder Alarm", message="PRICE UNDER PMax - SELL SIGNAL!")
buySignalk = crossover(MAvg, PMax)
plotshape(buySignalk and showsignalsk ? PMax*0.995 : na, title="Buy", text="Buy", location=location.absolute, style=shape.labelup, size=size.tiny, color=color.green, textcolor=color.white, transp=0)
sellSignallk = crossunder(MAvg, PMax)
plotshape(sellSignallk and showsignalsk ? PMax*1.005 : na, title="Sell", text="Sell", location=location.absolute, style=shape.labeldown, size=size.tiny, color=color.red, textcolor=color.white, transp=0)
mPlot = plot(rsi, title="", style=plot.style_circles, linewidth=0,display=display.none)
longFillColor = highlighting ? (MAvg>PMax ? color.green : na) : na
shortFillColor = highlighting ? (MAvg<PMax ? color.red : na) : na
fill(mPlot, pALL, title="UpTrend Highligter", color=longFillColor)
fill(mPlot, pALL, title="DownTrend Highligter", color=shortFillColor)
dummy0 = input(true, title = "=Backtest Inputs=")
FromDay = input(defval = 1, title = "From Day", minval = 1, maxval = 31)
FromMonth = input(defval = 1, title = "From Month", minval = 1, maxval = 12)
FromYear = input(defval = 2005, title = "From Year", minval = 2005)
ToDay = input(defval = 1, title = "To Day", minval = 1, maxval = 31)
ToMonth = input(defval = 1, title = "To Month", minval = 1, maxval = 12)
ToYear = input(defval = 9999, title = "To Year", minval = 2006)
Start = timestamp(FromYear, FromMonth, FromDay, 00, 00)
Finish = timestamp(ToYear, ToMonth, ToDay, 23, 59)
Timerange() =>
time >= Start and time <= Finish ? true : false
if buySignalk
strategy.entry("Long", strategy.long,when=Timerange())
if sellSignallk
strategy.entry("Short", strategy.short,when=Timerange())