Stratégie de stop-loss suivant la tendance basée sur le TFO et l'ATR

Aperçu
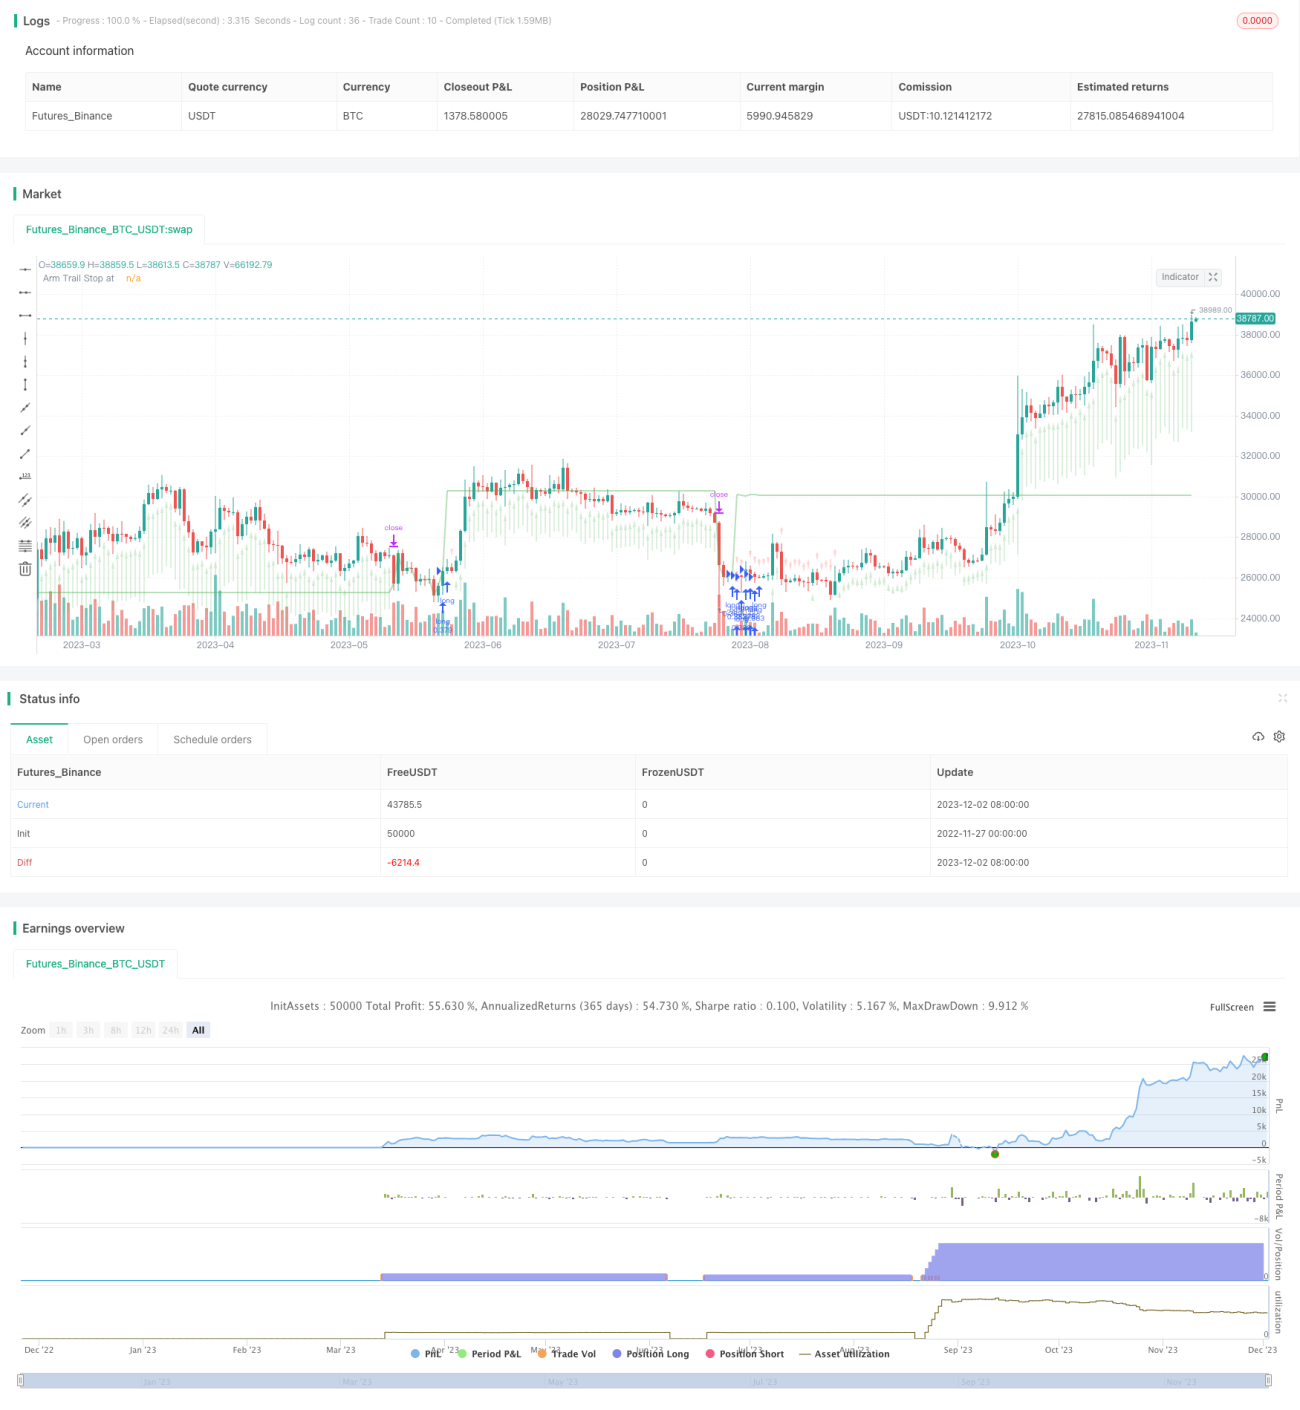
Cette stratégie est basée sur le Trend Flex Oscillator (TFO) et l'Average True Range (ATR) de Dr. John Ehlers. Il s'agit d'une stratégie de suivi des pertes de tendance. Elle s'applique aux marchés à plusieurs niveaux, ouvrant des positions à plusieurs niveaux lorsque le prix recule après l'Oversold.
Principe de stratégie
Cette stratégie combine les deux indicateurs TFO et ATR, en ouvrant une position en plus si les conditions d'achat sont remplies, et en laissant une position en moins si les conditions de vente sont remplies.
Conditions d'achat: lorsque le TFO est inférieur à un seuil particulier (indiquant une surchauffe) et que le TFO de la ligne K supérieure est inférieur à la ligne K actuelle (indiquant une hausse inversée du TFO) et que l'ATR est supérieur au seuil de fluctuation fixé (indiquant une augmentation de la fluctuation du marché), la satisfaction de ces trois conditions signifie que vous pouvez ouvrir plus de positions.
Conditions de placement: Lorsque le TFO est supérieur à un certain seuil (indiquant un excès de tête) et que l'ATR est supérieur au seuil fixé, toutes les positions en cours sont liquidées. De plus, la stratégie définit un arrêt de suivi, qui élimine toutes les positions en cours lorsque le prix tombe en dessous du prix d'arrêt de suivi fixé.
Cette stratégie permet d'ouvrir jusqu'à 15 positions multiples simultanément. Ses paramètres peuvent être ajustés pour différentes périodes de temps.
Avantages stratégiques
-
Le TFO peut capturer les signaux précoces de rupture de tendance, tandis que l'ATR peut saisir le moment où les fluctuations du marché augmentent.
-
Les paramètres d'achat et de vente et les paramètres d'arrêt sont réglables, ce qui permet une flexibilité d'utilisation. L'utilisateur peut ajuster les paramètres en fonction du marché pour optimiser.
-
La fonctionnalité de stop-loss est intégrée pour réduire les pertes en cas de situation extrême. La stratégie de stop-loss est un élément très important du trading quantitatif.
-
Il est possible d'augmenter les profits en augmentant les positions.
Risque stratégique
-
La stratégie consiste à faire trop, sans faire de failles, et à ne pas profiter d'un marché en baisse. Si le marché baissier est catastrophique, cela peut entraîner des pertes énormes.
-
Une mauvaise configuration des paramètres peut entraîner des transactions excessives ou des soldes négatifs. Des tests répétés sont nécessaires pour trouver la meilleure combinaison de paramètres.
-
Dans des situations extrêmes, le stop loss peut être inefficace et ne pas empêcher la survenue de pertes massives. C'est un problème que toutes les stratégies de stop loss peuvent rencontrer.
-
Les résultats de l'analyse ne reflètent pas complètement les transactions en temps réel, et les résultats en temps réel peuvent être déviés.
Optimisation de la stratégie
-
On peut envisager d'inclure une ligne de stop mobile dans les conditions de vente pour que la stratégie arrête les pertes à temps et contrôle efficacement le risque de baisse.
-
On peut étendre le mécanisme de prise de position pour ouvrir une position vide lorsque le TFO est inversé et que l'ATR est suffisamment grand pour que la stratégie s'applique aux marchés à ciel ouvert.
-
Des conditions de filtrage supplémentaires peuvent être ajoutées, telles que les variations de volume de transaction, afin de réduire l'impact des situations anormales sur la stratégie.
-
Il est possible de tester les paramètres de différentes périodes de temps et les résultats de la rétro-mesure pour trouver la meilleure combinaison de périodes et de paramètres.
Résumer
La stratégie intègre les avantages de l'analyse de la tendance et de la surveillance de la volatilité pour déterminer la direction du marché à travers une combinaison d'indicateurs TFO et ATR. Des mécanismes tels que l'ouverture supplémentaire, la clôture partielle et le stop-loss mobile sont configurés pour maximiser les gains et contrôler les risques, adaptés à la pratique multijoueurs. Il existe également un espace d'optimisation extensible, permettant d'améliorer encore la performance de la stratégie en ajoutant plus de filtres d'indicateurs et d'optimisations de paramètres.
/*backtest
start: 2022-11-27 00:00:00
end: 2023-12-03 00:00:00
period: 1d
basePeriod: 1h
exchanges: [{"eid":"Futures_Binance","currency":"BTC_USDT"}]
*/

// This source code is subject to the terms of the Mozilla Public License 2.0 at https://mozilla.org/MPL/2.0/
// © Chart0bserver
//
// Open Source attributions:- 1