Stratégie d'inversion RSI multifactorielle

Aperçu
Cette stratégie utilise l'indicateur RSI pour identifier le phénomène de sur-achat et de survente, en combinaison avec de nombreux facteurs auxiliaires tels que le MACD, l'indicateur stochastique et autres. La stratégie vise à capturer des opportunités de revers à court terme et appartient à la stratégie de revers.
Principe de stratégie
Cette stratégie utilise principalement l'indicateur RSI pour déterminer si le marché est en survente ou en survente. Lorsque l'indicateur RSI dépasse la ligne de survente définie, indiquant que le marché est probablement en survente, la stratégie choisit de faire une pause. Lorsque l'indicateur RSI est inférieur à la ligne de survente définie, indiquant que le marché est probablement en survente, la stratégie choisit de faire plus.
En outre, la stratégie introduit plusieurs facteurs auxiliaires, tels que le MACD et le stochastique. Ces facteurs auxiliaires filtrent les signaux de négociation faux positifs qui peuvent survenir. La stratégie ne prend de véritables mesures de négociation que lorsque l'indicateur RSI émet un signal et que les facteurs auxiliaires soutiennent ce signal. Cette combinaison de facteurs peut améliorer la fiabilité des signaux de la stratégie, ce qui améliore la stabilité de la stratégie.
Analyse des avantages
Le plus grand avantage de cette stratégie réside dans l'efficacité de la capture, l'amélioration de la qualité du signal grâce à l'authentification multifactorielle. Il s'agit principalement des aspects suivants:
- L'indicateur RSI est lui-même capable d'identifier les régimes de marché et peut ainsi identifier efficacement les phénomènes d'achat et de vente excessive.
- La qualité du signal a été améliorée grâce à l'utilisation d'outils de vérification multifonctionnels, qui ont permis de filtrer un grand nombre de faux positifs.
- Les stratégies ne sont pas sensibles aux paramètres et sont faciles à optimiser.
Les risques et les solutions
La stratégie présente également des risques, principalement dans deux domaines:
- Le risque de défaillance de revers. Le signal de revers dépend de l'opportunité statistique de l'arbitrage, sans exclure la probabilité d'un revers individuel. Le risque peut être contrôlé en réduisant la position ou en définissant un stop-loss.
- Le risque de perte dans une situation de plus en plus forte. La stratégie globale est toujours basée sur la manipulation inverse du marché. Il est inévitable que des pertes surviennent dans une situation de plus en plus forte. Cela nous oblige à juger avec précision les grandes tendances et, si nécessaire, à sauter les conditions défavorables par une intervention artificielle.
Direction d'optimisation
Cette stratégie nécessite des améliorations dans les domaines suivants:
- Tester différentes variétés pour trouver la meilleure combinaison de paramètres. La stratégie n'est pas sensible aux paramètres, mais il est toujours recommandé de trouver les paramètres optimaux pour différentes variétés.
- Ajout de mécanismes d'exit adaptatifs. On peut tester l'ajout d'arrêts dynamiques, d'exits temporels, etc. pour adapter les stratégies aux changements du marché.
- L'introduction d'algorithmes d'apprentissage de la machine permet d'essayer de faire apprendre aux modèles la probabilité de réussite de l'inversion, ce qui améliore le taux de réussite de la stratégie.
Résumer
Cette stratégie est globalement une stratégie d'inversion de courte ligne. L'utilisation de l'indicateur RSI pour juger de la capacité de sur-achat et de survente, tout en effectuant une vérification multifactorielle à l'aide de divers outils auxiliaires, améliore la qualité du signal.
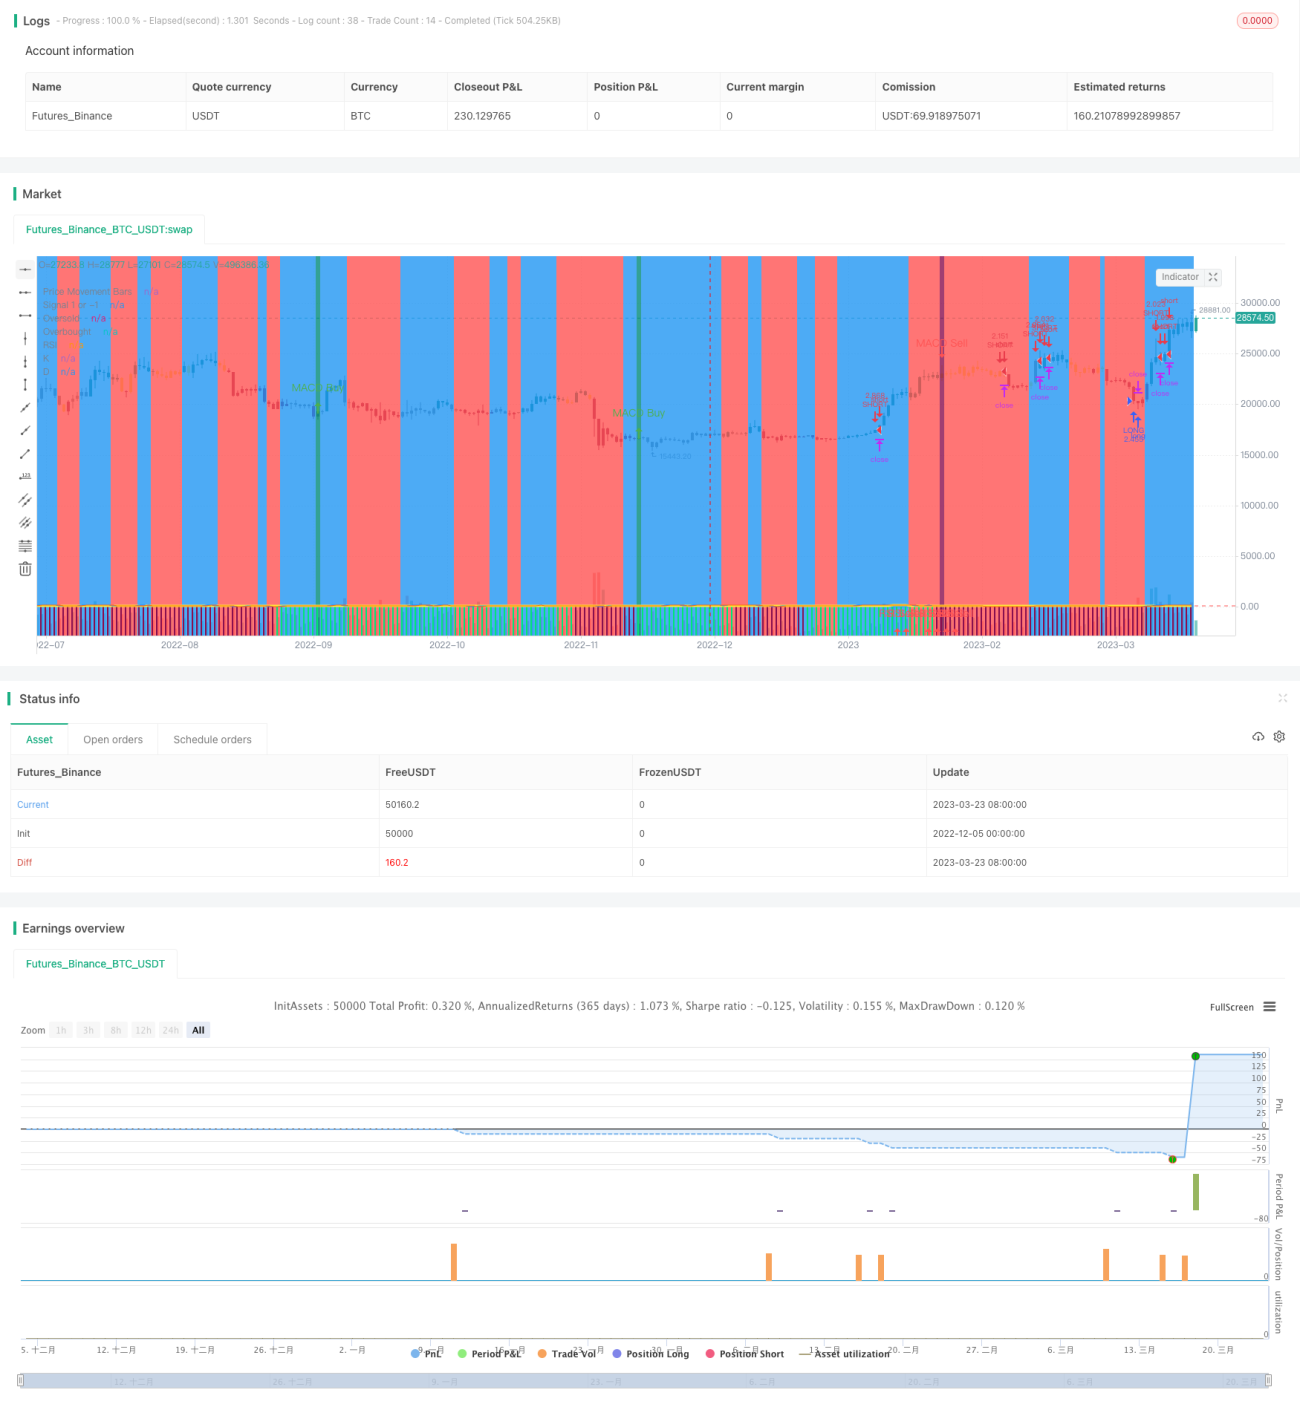
/*backtest
start: 2022-12-05 00:00:00
end: 2023-03-24 00:00:00
period: 1d
basePeriod: 1h
exchanges: [{"eid":"Futures_Binance","currency":"BTC_USDT"}]
*/

// This source code is subject to the terms of the Mozilla Public License 2.0 at https://mozilla.org/MPL/2.0/
//@version=4

strategy(shorttitle='Ain1',title='All in One Strategy', overlay=true, initial_capital = 1000, process_orders_on_close=true, default_qty_type = strategy.percent_of_equity, default_qty_value = 100, commission_type=strategy.commission.percent, commission_value=0.18, calc_on_every_tick=true)- 1