Stratégie de suivi de tendance à double inversion

Aperçu
Il s'agit d'une stratégie de suivi de la tendance combinant un double signal de revers. Elle intègre la stratégie de 123 revers et la stratégie de l'indice de performance pour suivre les revers de prix et obtenir des jugements de tendance plus fiables.
Principe de stratégie
Cette stratégie est composée de deux sous-stratégies:
-
123 stratégies de retour
Le signal de retour est jugé à l'aide d'une ligne K de 14 jours. Les règles spécifiques sont:
- Signaux multiples: les deux premiers jours de clôture sont en baisse, la clôture actuelle de la ligne K est supérieure à la clôture du jour précédent, le Stochastic Slow du 9e jour est inférieur à 50
- Signaux de tête vide: les deux premiers jours de clôture sont en hausse, la clôture actuelle de la ligne K est inférieure à la clôture du jour précédent, le jour 9 Stochastic Fast est supérieur à 50
-
Stratégies de performance
Les hauts et les bas des 14 derniers jours sont utilisés comme indicateur. Les règles sont les suivantes:
- L'indice de performance est > 0, générant un signal multicouche
- Indice de performance < (<) 0), générant un signal de tête vide
Le signal final est la combinaison de deux types de signaux. C'est-à-dire qu'il faut un signal polyvalent en même temps pour produire une opération d'achat et de vente réelle.
Il est possible de filtrer une partie du bruit, ce qui rend le signal plus fiable.
Avantages stratégiques
Ce système de double inversion présente les avantages suivants:
- La combinaison de deux facteurs rend le signal plus fiable
- Il permet de filtrer efficacement le bruit du marché et d'éviter les faux signaux.
- 123 forme classique et pratique, facile à juger et à reproduire
- L'indice de performance peut être utilisé pour déterminer les tendances futures.
- La combinaison de paramètres est flexible et peut être optimisée
Risque stratégique
Cette stratégie comporte aussi des risques:
- La tendance à la hausse des prix a été signalée par le rapport de la Banque mondiale sur le marché mondial de l'énergie.
- La combinaison des deux conditions a entraîné une diminution du signal, ce qui pourrait affecter la rentabilité.
- Les investisseurs ont besoin d'un jugement par les pairs et sont vulnérables aux fluctuations particulières des actions.
- Des problèmes de paramètres peuvent entraîner une déviation du signal
Les optimisations suivantes peuvent être envisagées:
- Ajustez des paramètres tels que la longueur de la ligne K, la période stochastique, etc.
- Optimiser la logique de jugement des doubles signaux
- Cela peut être dû à une combinaison de facteurs, comme le nombre d'accouplements, etc.
- Augmentation du mécanisme de prévention des pertes
Résumer
La stratégie intègre un double jugement de revers, permettant de détecter efficacement les points de retournement des prix. Bien que la probabilité d'apparition du signal soit réduite, la fiabilité est élevée et convient à la capture des tendances de la ligne moyenne et longue. L'efficacité de la stratégie peut être encore améliorée par l'ajustement des paramètres et l'optimisation multifactorielle.
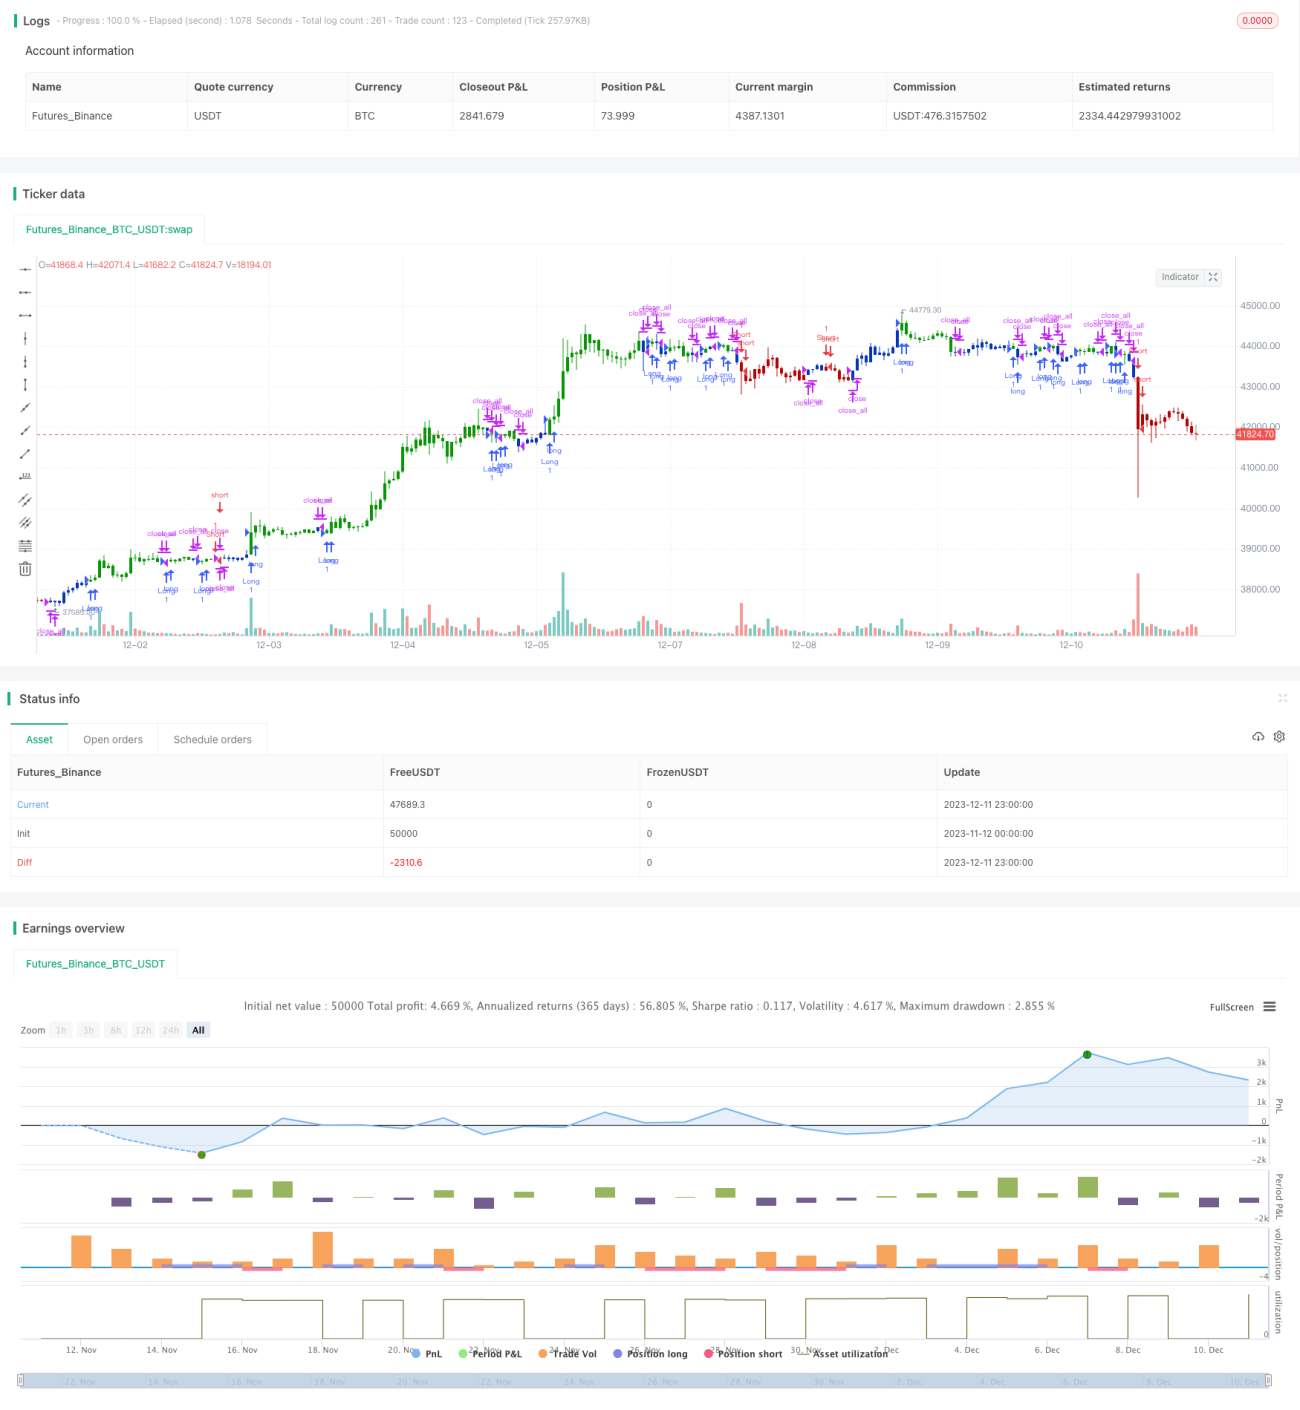
/*backtest
start: 2023-11-12 00:00:00
end: 2023-12-12 00:00:00
period: 1h
basePeriod: 15m
exchanges: [{"eid":"Futures_Binance","currency":"BTC_USDT"}]
*/

//@version=4
////////////////////////////////////////////////////////////
//  Copyright by HPotter v1.0 15/04/2021
// This is combo strategies for get a cumulative signal. - 1