
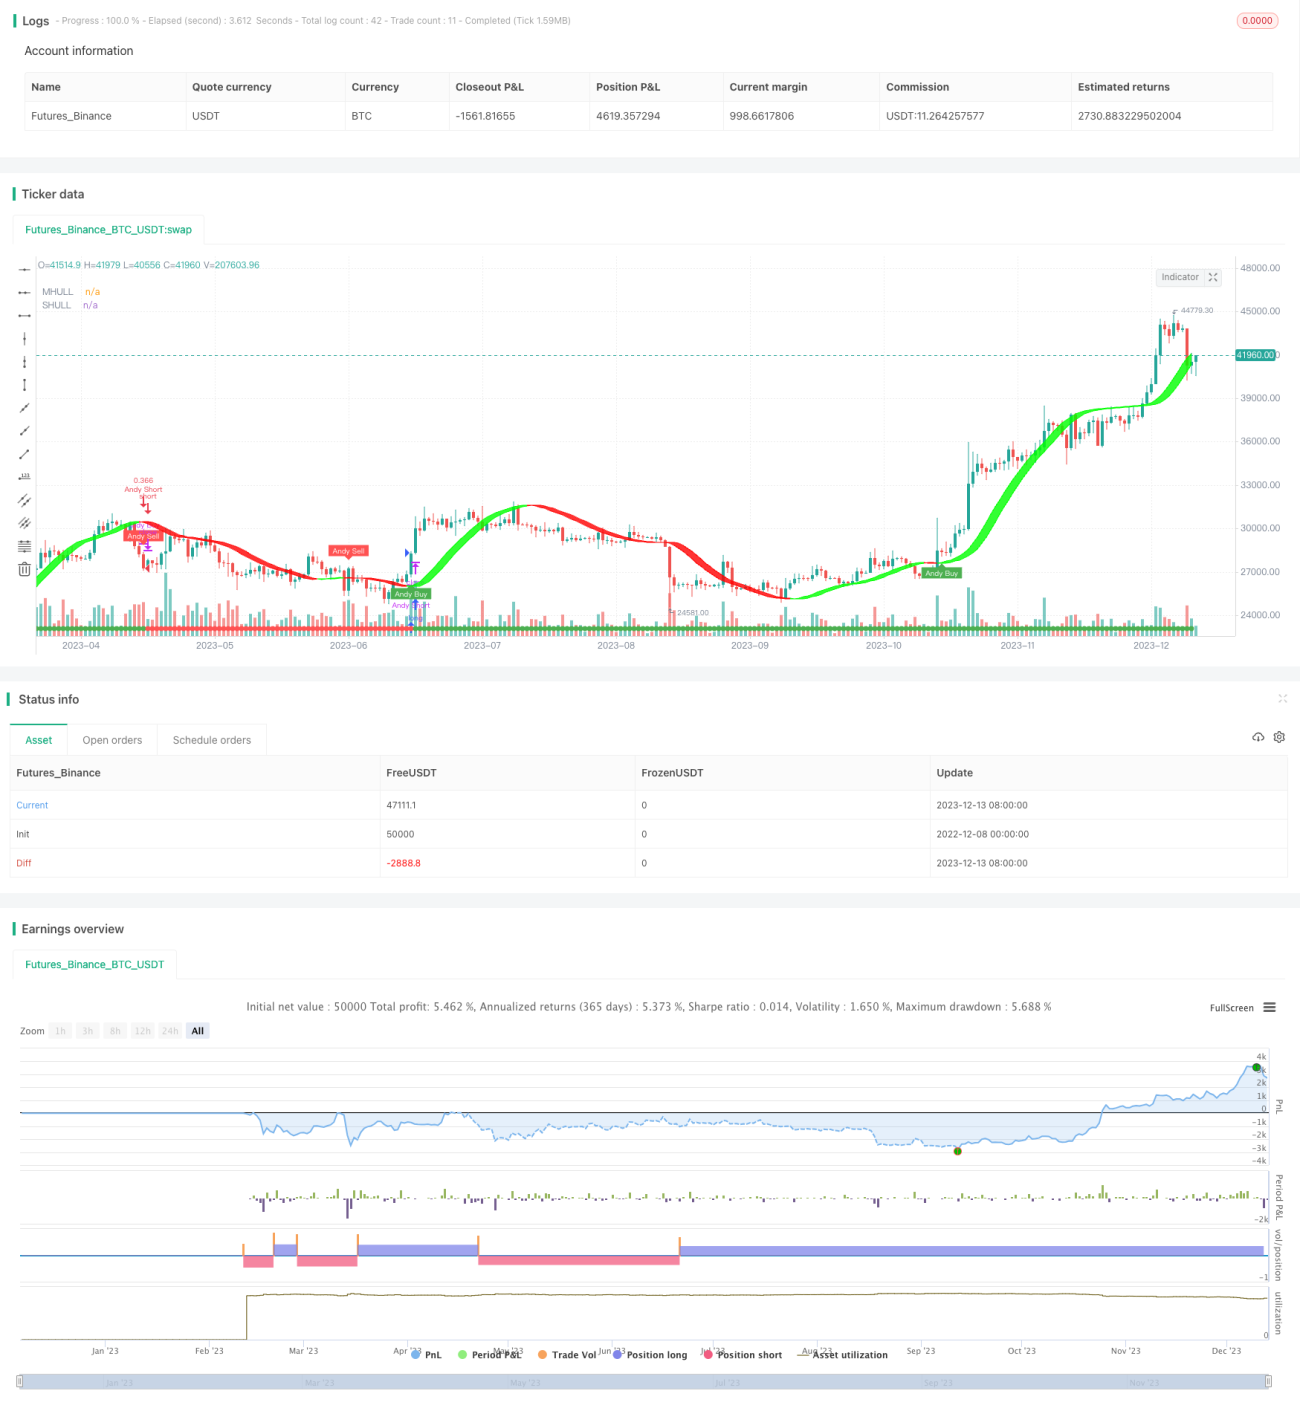
La stratégie Dynamic Momentum Oscillator Trading Strategy (stratégie DMO) est une stratégie de négociation de courte durée de 15 minutes basée sur des indicateurs de dynamique oscillante. La stratégie, combinée à une variété d’indicateurs techniques, fournit des signaux de négociation de haute précision, aidant efficacement les traders novices à prendre des décisions d’achat et de vente en peu de temps, à contrôler les risques et à améliorer la probabilité de profit.
La stratégie utilise d’abord le canal de Doinchian pour déterminer la direction de la tendance principale du marché. Lorsque le prix franchit ce canal, c’est un signal de hausse, et si le prix franchit ce canal, c’est un signal de baisse. Ensuite, la stratégie utilise l’une des 3 variantes de la moyenne mobile de Hull, combinée à une analyse de tendance plus précise adaptée au canal ATR.
Le plus grand avantage de la stratégie DMO réside dans la combinaison organique de plusieurs indicateurs, qui peuvent être vérifiés les uns par les autres, ce qui permet de filtrer les faux signaux et de rendre chaque signal de transaction plus précis et fiable. En outre, la méthode de Doinchian pour déterminer la tendance principale est simple et directe.
Bien que la stratégie DMO soit relativement stable et fiable, toute stratégie de trading quantitatif comporte inévitablement un certain risque. En particulier, lorsque la ligne rapide et la ligne médiane produisent des forks morts, il est toujours possible que ce soit un faux signal s’il n’y a pas d’autres indicateurs vérifiés. De plus, comme toutes les stratégies de courte ligne, la DMO est confrontée à un certain risque de survente.
Les stratégies de DMO peuvent être optimisées dans les dimensions suivantes: premièrement, ajuster les paramètres de la Hull MA, optimiser la longueur des moyennes mobiles, l’équilibre entre l’effet de lissage et la sensibilité; deuxièmement, améliorer la logique de jugement de la voie de Doinchian, comme l’ajustement des paramètres de la voie, ou l’ajout de restrictions d’entrée de conditions supplémentaires; troisièmement, essayer d’autres indicateurs au lieu de la moyenne semi-entière, comme la bande de Brin, le KDJ, etc., pour améliorer l’effet de filtrage auxiliaire; quatrièmement, désigner des intervalles de négociation appropriés en fonction des caractéristiques de différentes marques, comme une stratégie de 5 minutes ou de 30 minutes. Ces initiatives d’optimisation ont contribué à améliorer la stabilité stratégique en adaptant les stratégies de DMO en fonction de l’environnement du marché et des caractéristiques de la marque.
La DMO est une stratégie de courte ligne qui combine plusieurs indicateurs pour optimiser le portefeuille. Elle intègre le canal de Doinchian, la Hull MA et la demi-mesure complète, juge efficacement les tendances du marché et produit des signaux de négociation précis.
/*backtest
start: 2022-12-08 00:00:00
end: 2023-12-14 00:00:00
period: 1d
basePeriod: 1h
exchanges: [{"eid":"Futures_Binance","currency":"BTC_USDT"}]
*/
// This source code is subject to the terms of the Mozilla Public License 2.0 at https://mozilla.org/MPL/2.0/
// © kgynofomo
//@version=5
strategy(title="[Salavi] | Andy Super Pro Strategy [BTC|M15]",overlay = true, pyramiding = 1,initial_capital = 10000, default_qty_type = strategy.cash,default_qty_value = 10000)
//Doinchian Trend Ribbon
dlen = input.int(defval=30, minval=10)
dchannel(len) =>
float hh = ta.highest(len)
float ll = ta.lowest(len)
int trend = 0
trend := close > hh[1] ? 1 : close < ll[1] ? -1 : nz(trend[1])
trend
dchannelalt(len, maintrend) =>
float hh = ta.highest(len)
float ll = ta.lowest(len)
int trend = 0
trend := close > hh[1] ? 1 : close < ll[1] ? -1 : nz(trend[1])
maintrend == 1 ? trend == 1 ? #00FF00ff : #00FF009f : maintrend == -1 ? trend == -1 ? #FF0000ff : #FF00009f : na
maintrend = dchannel(dlen)
donchian_bull = maintrend==1
donchian_bear = maintrend==-1
//Hulls
src = input(hlc3, title='Source')
modeSwitch = input.string('Hma', title='Hull Variation', options=['Hma', 'Thma', 'Ehma'])
length = input(55, title='Length')
lengthMult = input(1.0, title='Length multiplier ')
useHtf = false
htf = '240'
switchColor = true
candleCol = false
visualSwitch = true
thicknesSwitch = 1
transpSwitch = 40
//FUNCTIONS
//HMA
HMA(_src, _length) =>
ta.wma(2 * ta.wma(_src, _length / 2) - ta.wma(_src, _length), math.round(math.sqrt(_length)))
//EHMA
EHMA(_src, _length) =>
ta.ema(2 * ta.ema(_src, _length / 2) - ta.ema(_src, _length), math.round(math.sqrt(_length)))
//THMA
THMA(_src, _length) =>
ta.wma(ta.wma(_src, _length / 3) * 3 - ta.wma(_src, _length / 2) - ta.wma(_src, _length), _length)
//SWITCH
Mode(modeSwitch, src, len) =>
modeSwitch == 'Hma' ? HMA(src, len) : modeSwitch == 'Ehma' ? EHMA(src, len) : modeSwitch == 'Thma' ? THMA(src, len / 2) : na
//OUT
_hull = Mode(modeSwitch, src, int(length * lengthMult))
HULL = useHtf ? request.security(syminfo.ticker, htf, _hull) : _hull
MHULL = HULL[0]
SHULL = HULL[2]
//COLOR
hullColor = switchColor ? HULL > HULL[2] ? #00ff00 : #ff0000 : #ff9800
hull_bull = HULL > HULL[2]
bull_start = hull_bull and hull_bull[1]==false
hull_bear = HULL < HULL[2]
bear_start = hull_bear and hull_bear[1]==false
barcolor(color=candleCol ? switchColor ? hullColor : na : na)
//halftrend
amplitude = input(title='Amplitude', defval=2)
channelDeviation = input(title='Channel Deviation', defval=2)
// showArrows = input(title='Show Arrows', defval=true)
// showChannels = input(title='Show Channels', defval=true)
var int trend = 0
var int nextTrend = 0
var float maxLowPrice = nz(low[1], low)
var float minHighPrice = nz(high[1], high)
var float up = 0.0
var float down = 0.0
float atrHigh = 0.0
float atrLow = 0.0
float arrowUp = na
float arrowDown = na
atr2 = ta.atr(100) / 2
dev = channelDeviation * atr2
highPrice = high[math.abs(ta.highestbars(amplitude))]
lowPrice = low[math.abs(ta.lowestbars(amplitude))]
highma = ta.sma(high, amplitude)
lowma = ta.sma(low, amplitude)
if nextTrend == 1
maxLowPrice := math.max(lowPrice, maxLowPrice)
if highma < maxLowPrice and close < nz(low[1], low)
trend := 1
nextTrend := 0
minHighPrice := highPrice
minHighPrice
else
minHighPrice := math.min(highPrice, minHighPrice)
if lowma > minHighPrice and close > nz(high[1], high)
trend := 0
nextTrend := 1
maxLowPrice := lowPrice
maxLowPrice
if trend == 0
if not na(trend[1]) and trend[1] != 0
up := na(down[1]) ? down : down[1]
arrowUp := up - atr2
arrowUp
else
up := na(up[1]) ? maxLowPrice : math.max(maxLowPrice, up[1])
up
atrHigh := up + dev
atrLow := up - dev
atrLow
else
if not na(trend[1]) and trend[1] != 1
down := na(up[1]) ? up : up[1]
arrowDown := down + atr2
arrowDown
else
down := na(down[1]) ? minHighPrice : math.min(minHighPrice, down[1])
down
atrHigh := down + dev
atrLow := down - dev
atrLow
ht = trend == 0 ? up : down
var color buyColor = color.blue
var color sellColor = color.red
htColor = trend == 0 ? buyColor : sellColor
// htPlot = plot(ht, title='HalfTrend', linewidth=2, color=htColor)
// atrHighPlot = plot(showChannels ? atrHigh : na, title='ATR High', style=plot.style_circles, color=color.new(sellColor, 0))
// atrLowPlot = plot(showChannels ? atrLow : na, title='ATR Low', style=plot.style_circles, color=color.new(buyColor, 0))
// fill(htPlot, atrHighPlot, title='ATR High Ribbon', color=color.new(sellColor, 90))
// fill(htPlot, atrLowPlot, title='ATR Low Ribbon', color=color.new(buyColor, 90))
HalfTrend_buySignal = not na(arrowUp) and trend == 0 and trend[1] == 1
HalfTrend_sellSignal = not na(arrowDown) and trend == 1 and trend[1] == 0
// plotshape(showArrows and buySignal ? atrLow : na, title='Arrow Up', style=shape.triangleup, location=location.absolute, size=size.tiny, color=color.new(buyColor, 0))
// plotshape(showArrows and sellSignal ? atrHigh : na, title='Arrow Down', style=shape.triangledown, location=location.absolute, size=size.tiny, color=color.new(sellColor, 0))
//ema
filter_ema = ta.ema(close,200)
ema_bull = close>filter_ema
ema_bear = close<filter_ema
atr_length = input.int(7)
atr = ta.atr(atr_length)
atr_rsi_length = input.int(50)
atr_rsi = ta.rsi(atr,atr_rsi_length)
atr_valid = atr_rsi>50
longCondition = bull_start and atr_valid
shortCondition = bear_start and atr_valid
Exit_long_condition = shortCondition
Exit_short_condition = longCondition
if longCondition
strategy.entry("Andy Buy",strategy.long, limit=close,comment="Andy Buy Here")
if Exit_long_condition
strategy.close("Andy Buy",comment="Andy Buy Out")
// strategy.entry("Andy fandan Short",strategy.short, limit=close,comment="Andy 翻單 short Here")
// strategy.close("Andy fandan Buy",comment="Andy short Out")
if shortCondition
strategy.entry("Andy Short",strategy.short, limit=close,comment="Andy short Here")
// strategy.exit("STR","Long",stop=longstoploss)
if Exit_short_condition
strategy.close("Andy Short",comment="Andy short Out")
// strategy.entry("Andy fandan Buy",strategy.long, limit=close,comment="Andy 翻單 Buy Here")
// strategy.close("Andy fandan Short",comment="Andy Buy Out")
inLongTrade = strategy.position_size > 0
inLongTradecolor = #58D68D
notInTrade = strategy.position_size == 0
inShortTrade = strategy.position_size < 0
// bgcolor(color = inLongTrade?color.rgb(76, 175, 79, 70):inShortTrade?color.rgb(255, 82, 82, 70):na)
plotshape(close!=0,location = location.bottom,color = inLongTrade?color.green:inShortTrade?color.red:na)
plotshape(longCondition, title='Buy', text='Andy Buy', style=shape.labelup, location=location.belowbar, color=color.new(color.green, 0), textcolor=color.new(color.white, 0), size=size.tiny)
plotshape(shortCondition, title='Sell', text='Andy Sell', style=shape.labeldown, location=location.abovebar, color=color.new(color.red, 0), textcolor=color.new(color.white, 0), size=size.tiny)
Fi1 = plot(MHULL, title='MHULL', color=hullColor, linewidth=thicknesSwitch, transp=50)
Fi2 = plot(SHULL, title='SHULL', color=hullColor, linewidth=thicknesSwitch, transp=50)
fill(Fi1, Fi2, title='Band Filler', color=hullColor, transp=transpSwitch)