Stratégie de retournement du point bas

1
Follow
1779
Followers
Aperçu
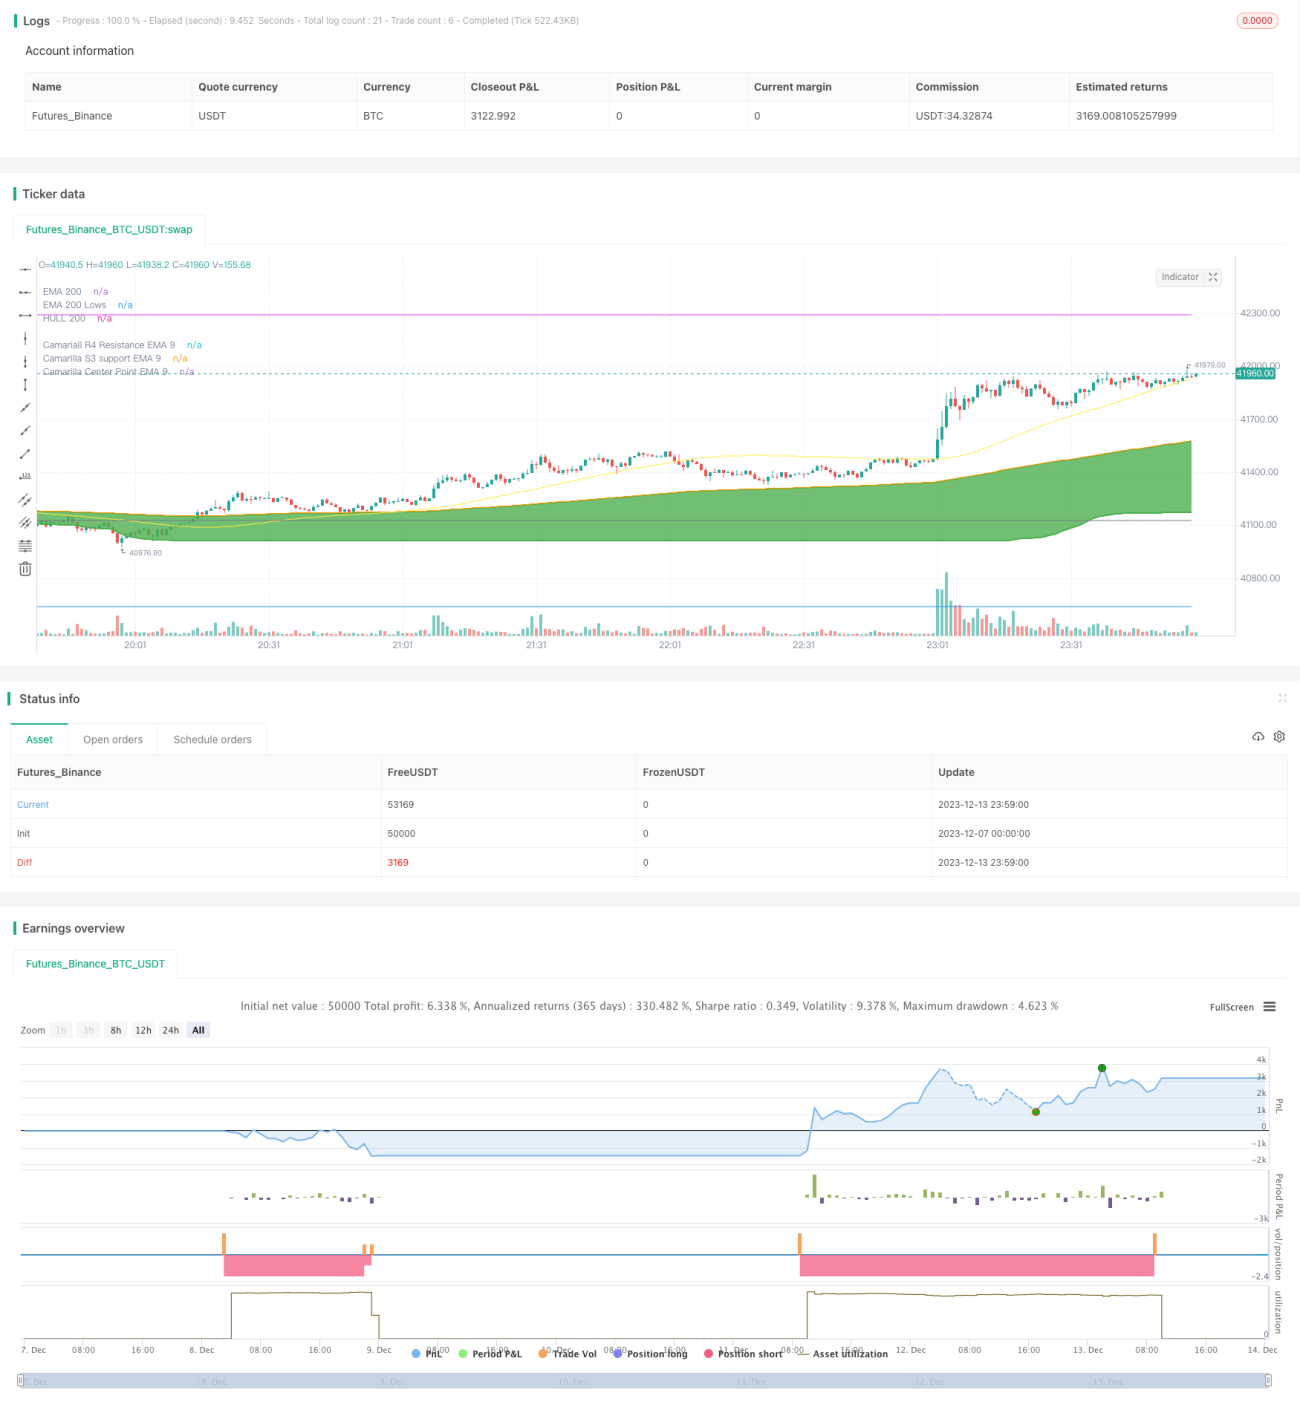
Cette stratégie est basée sur le plus bas du marché pour effectuer des opérations de revers. Elle utilise le plus bas de l'EMA de 200 jours, combiné à la résistance du support de la camarelle pour déterminer le plus bas du marché et effectue des opérations supplémentaires lorsque le prix rebondit.
Principe de stratégie
- Le prix le plus bas de l'EMA de 200 jours est calculé comme étant proche du plus bas du marché lorsqu'il ferme en dessous de cette EMA.
- Calculer l'EMA de 9 jours de la camarelle 3 (S3) comme un support important
- On calcule ensuite l'EMA de 9 jours du centre de Camaleira, appelée ema_center_9, qui sert de signal de retour.
- Lorsque l'ema_center_9 porte l'ema200Lows et que les 3 premières lignes K sont inférieures à l'ema200Lows, effectuez plusieurs opérations.
- La méthode de stop loss est l'ATR stop loss et suit le mouvement du prix minimum.
- Les bénéfices cibles sont les suivants: ema_h4_9 ((résistance de la camarelle 4) et ema_s3_9 ((support de la camarelle 3) <unk>
Analyse des avantages
- Utilisez l'EMA de 200 jours pour déterminer la zone la plus basse du marché et éviter une plus grande baisse à mi-chemin.
- La position de l'appui de la camarelle, associée au centre, permet de déterminer avec plus de précision le point de basculement.
- L'arrêt ATR rend le stop plus raisonnable, le suivi des points bas est plus avantageux et le verrouillage plus lucratif.
Analyse des risques
- Les positions à long terme sont plus risquées. Cette stratégie est mieux adaptée aux opérations à court terme.
- Le stop loss peut être plus élevé dans le cas d'une situation de marché. Il peut être ajusté en fonction des paramètres ATR.
- Le jugement inverse de Camaleira n'est pas forcément fiable à 100%, il peut y avoir des erreurs.
Direction d'optimisation
- Les signaux de retournement peuvent être jugés en combinaison avec d'autres indicateurs, tels que le RSI.
- Il est possible d'étudier les paramètres des différentes variétés pour trouver des paramètres plus favorables.
- Les méthodes d'apprentissage automatique peuvent être essayées pour ajuster dynamiquement l'arrêt ATR.
Résumer
La stratégie utilise les points bas de l'EMA avec l'indicateur Camarela pour déterminer les zones les plus basses du marché et les points de retournement. La stratégie est plus complète et a une certaine valeur de combat.
Source
Pine
/*backtest
start: 2023-12-07 00:00:00
end: 2023-12-14 00:00:00
period: 1m
basePeriod: 1m
exchanges: [{"eid":"Futures_Binance","currency":"BTC_USDT"}]
*/

// This source code is subject to the terms of the Mozilla Public License 2.0 at https://mozilla.org/MPL/2.0/
// © mohanee

//Using the lowest of low of ema200, you can find the bottomStrategy parameters
Related strategies
Comment
All comments (0)
No data
- 1