Stratégie quantitative de stop-loss mobile à double stop-profit et double stop-loss
Aperçu
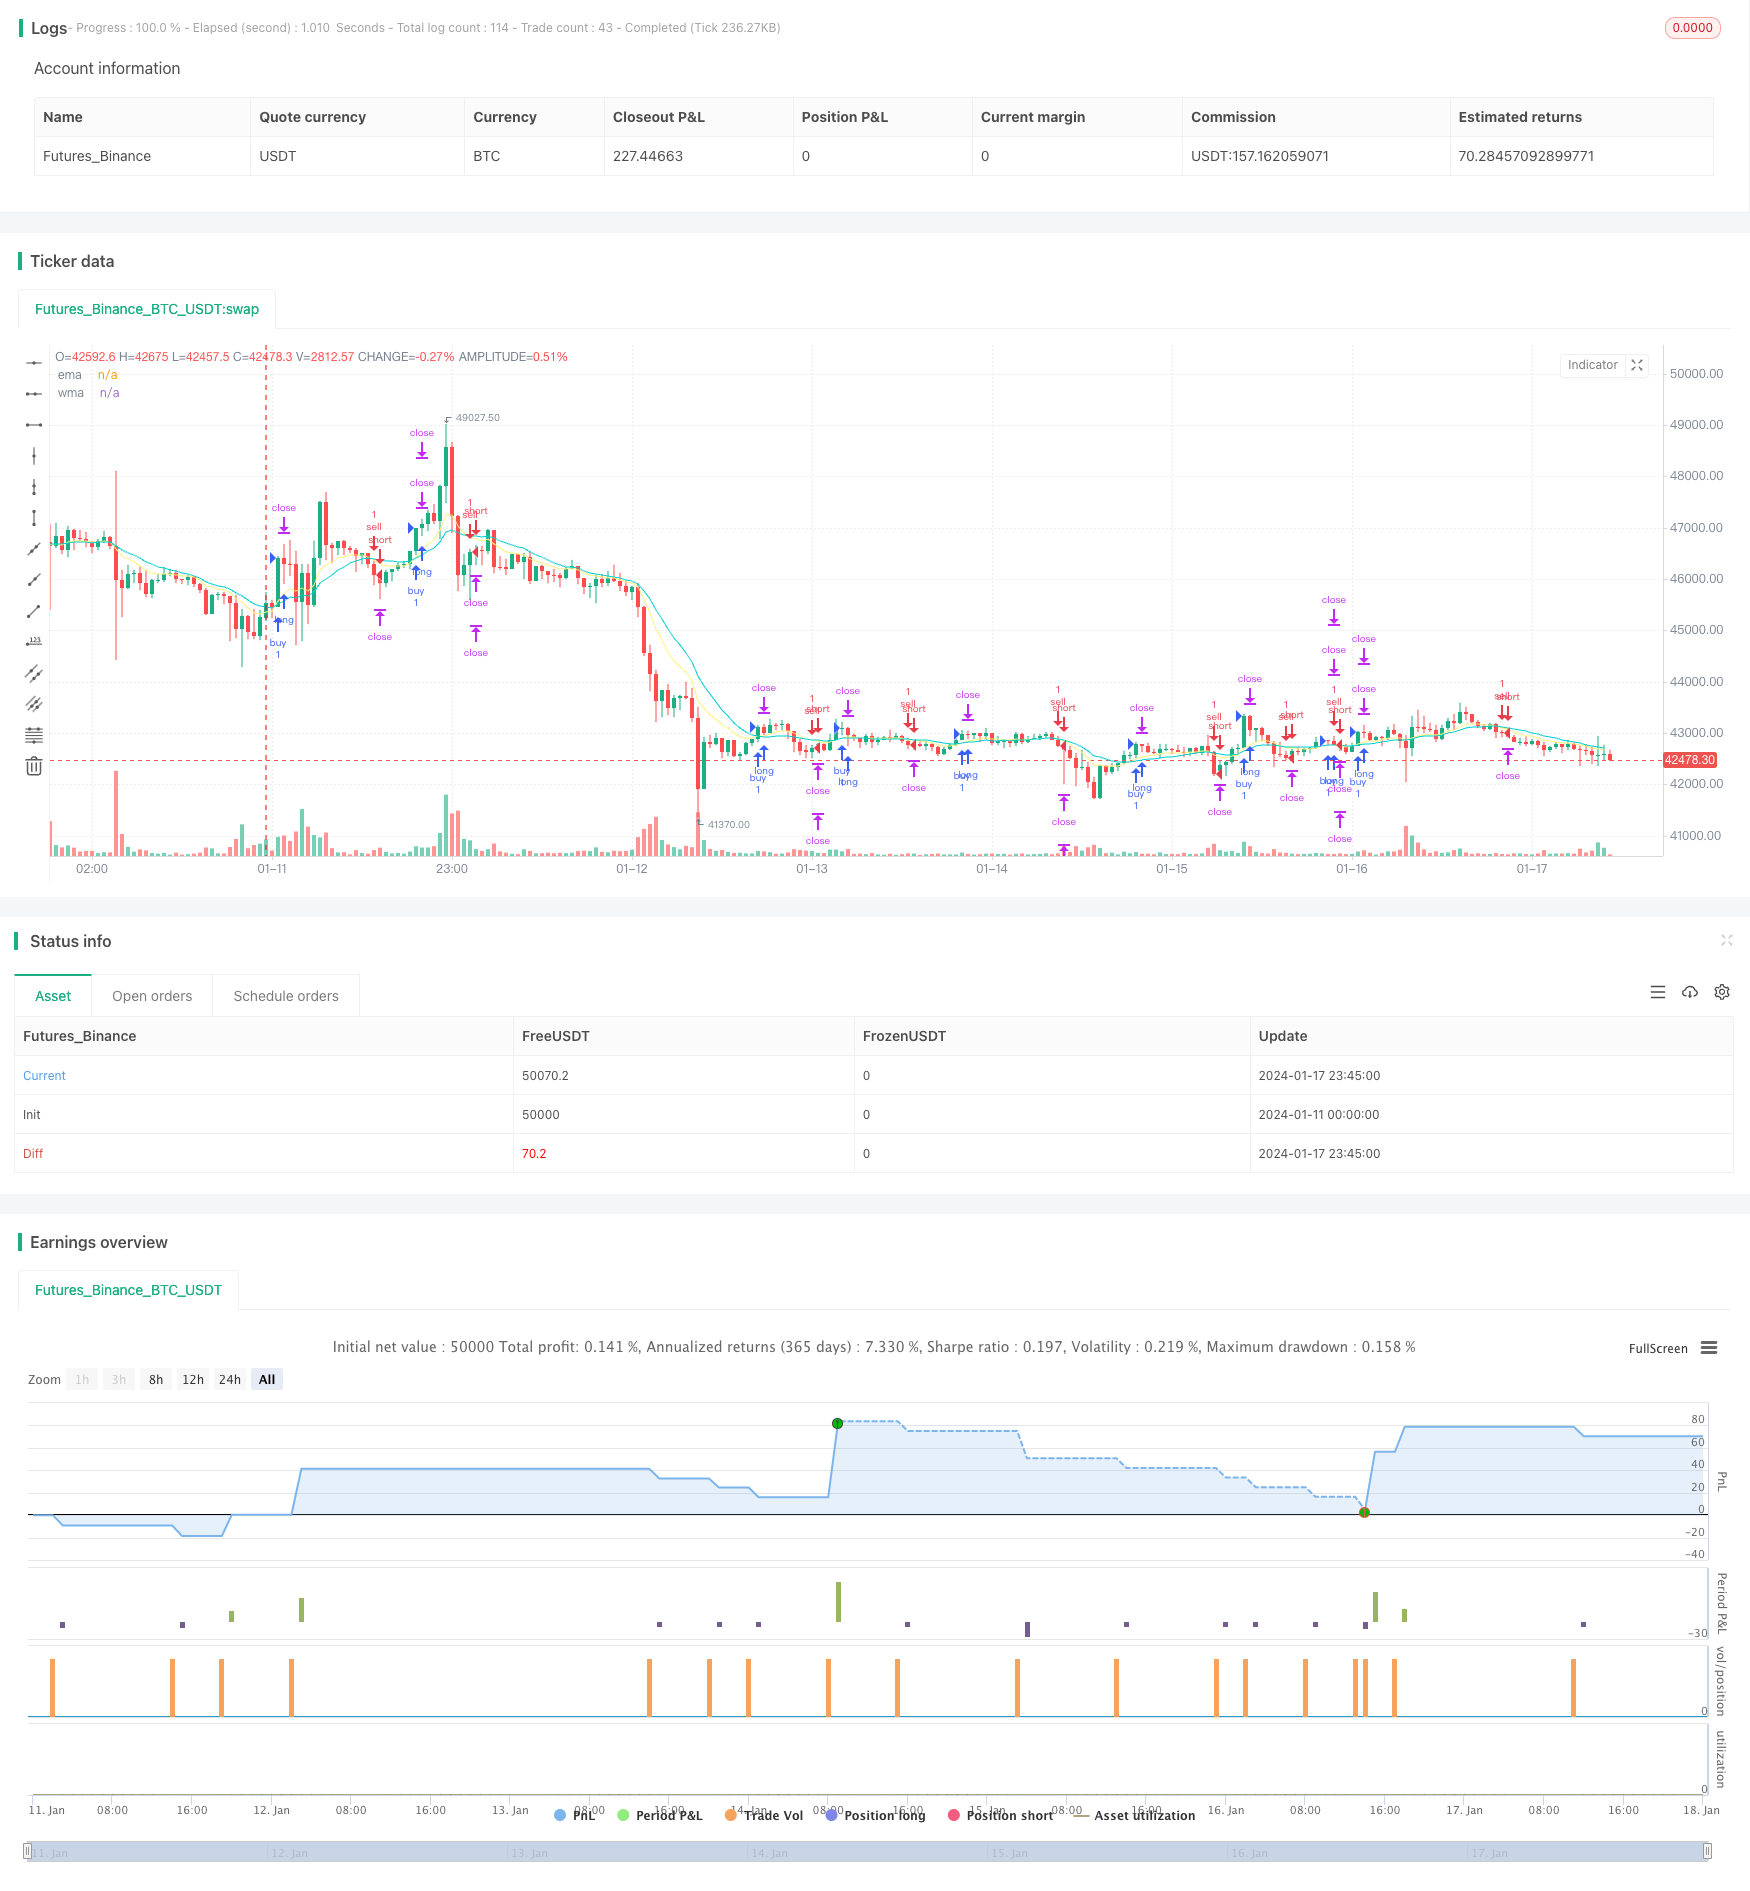
Cette stratégie est une stratégie de trading quantitatif de Bitcoin basée sur le double stop, le double stop loss et le stop mobile. La stratégie utilise le croisement de l’EMA et de la WMA comme signal d’entrée, adopte une approche de gestion des risques de double stop double stop loss, adopte un stop mobile garantissant une partie des bénéfices après que le premier stop point ait été atteint, et continue à rechercher plus de profit.
Principe de stratégie
Lorsque l’EMA est en WMA par en-dessous, il fait une entrée en plus; lorsque l’EMA est en WMA par en-dessous, il fait une entrée en vide.
En ce qui concerne les arrêts, deux arrêts sont définis, le premier arrêt est réglé à 20 points au-dessus du point d’entrée et le second arrêt est réglé à 40 points au-dessus du point d’entrée.
En ce qui concerne le stop-loss, deux points de stop-loss ont également été définis, le premier point de stop-loss étant 20 points en dessous du point d’entrée, et le second point de stop-loss étant le point d’entrée lui-même.
Lorsque le prix atteint le premier point d’arrêt, il élimine 50% de la position et déplace le point d’arrêt vers le point d’entrée pour poursuivre la poursuite du deuxième point d’arrêt.
La stratégie a donc eu trois conséquences:
- Le prix atteint d’abord le point de rupture, perdant 2% du capital;
- le prix a touché le premier point d’arrêt et a obtenu un profit de 1%, puis le deuxième point d’arrêt et un profit de 1%;
- Le prix touche d’abord le premier point d’arrêt et obtient un profit de 1%, puis continue à fonctionner et touche le deuxième point d’arrêt et obtient un profit de 3%.
Analyse des avantages
Le plus grand avantage de cette stratégie réside dans le système de gestion des risques. En mettant en place des doubles arrêts et doubles arrêts, il est possible, après avoir obtenu une partie des bénéfices, de prendre des arrêts mobiles pour verrouiller les bénéfices et continuer à rechercher plus de profit. Cela peut améliorer considérablement la rentabilité.
Un autre avantage est que la stratégie divise les résultats d’une seule transaction en trois situations, ce qui réduit la probabilité d’une seule perte, ce qui rend les gains globaux plus stables. La stratégie ordinaire n’a que deux résultats, soit une perte de 2% ou un profit supérieur à 2%.
Analyse des risques
Le risque de cette stratégie provient principalement de la configuration du point de rupture. Une rupture trop large peut entraîner une perte trop importante; une rupture trop étroite peut être affectée par le bruit du marché. Cela nécessite de définir une rupture appropriée en fonction des caractéristiques et des fluctuations de différentes variétés.
Un autre risque est le risque de perte de la partie de la position qui reste après le premier arrêt. Si les pertes dépassent les bénéfices du premier arrêt, une partie ou la totalité des bénéfices seront compensées. Cela nécessite une exécution stricte des arrêts mobiles pour verrouiller les bénéfices.
Direction d’optimisation
Cette stratégie peut être optimisée dans les domaines suivants:
Testez différentes combinaisons de paramètres pour trouver le paramètre optimal. Par exemple, vous pouvez tester 15 points, 25 points de distance de stop-loss.
Essayez d’autres combinaisons d’indicateurs, tels que les signaux KDJ, MACD, etc. pour décider de l’admission.
Optimiser le ratio de position pour le premier point d’arrêt, soit 50% ou 30% ou 70% de plus.
Tester les réglages de la vitesse de suivi des pertes mobiles pour s’assurer que la marge de perte est la plus petite possible, tout en garantissant la rentabilité.
Résumer
Cette stratégie est très robuste dans l’ensemble, grâce à des doubles arrêts, des doubles arrêts et des arrêts mobiles, ce qui permet d’augmenter considérablement le niveau de profit et de réduire le risque de la queue. Il y a aussi beaucoup d’espace pour l’optimisation et un meilleur effet peut être obtenu grâce à l’ajustement des paramètres et à la combinaison d’indicateurs.
/*backtest
start: 2024-01-11 00:00:00
end: 2024-01-18 00:00:00
period: 45m
basePeriod: 5m
exchanges: [{"eid":"Futures_Binance","currency":"BTC_USDT"}]
*/

//@version=4
strategy("SL1 Pips after TP1 (MA)", commission_type=strategy.commission.cash_per_order, overlay=true)

// Strategy
Buy  = input(true)
Sell = input(true)

// Date Range
start_year    = input(title='Start year'   ,defval=2020)
start_month   = input(title='Start month'  ,defval=1)
start_day     = input(title='Start day'    ,defval=1)
start_hour    = input(title='Start hour'   ,defval=0)
start_minute  = input(title='Start minute' ,defval=0)
end_time      = input(title='set end time?',defval=false)
end_year      = input(title='end year'     ,defval=2019)
end_month     = input(title='end month'    ,defval=12)
end_day       = input(title='end day'      ,defval=31)
end_hour      = input(title='end hour'     ,defval=23)
end_minute    = input(title='end minute'   ,defval=59)

// MA
ema_period = input(title='EMA period',defval=10)
wma_period = input(title='WMA period',defval=20)
ema        = ema(close,ema_period)
wma        = wma(close,wma_period)

// Entry Condition
buy =
 crossover(ema,wma) and
 nz(strategy.position_size) == 0 and Buy

sell =
 crossunder(ema,wma) and
 nz(strategy.position_size) == 0 and Sell

// Pips
pip = input(20)*10*syminfo.mintick

// Trading parameters //
var bool  LS  = na
var bool  SS  = na
var float EP  = na
var float TVL = na
var float TVS = na
var float TSL = na
var float TSS = na
var float TP1 = na
var float TP2 = na
var float SL1 = na
var float SL2 = na

if buy or sell and strategy.position_size == 0
    EP  := close
    SL1 := EP - pip     * (sell?-1:1)
    SL2 := EP - pip     * (sell?-1:1)
    TP1 := EP + pip     * (sell?-1:1)
    TP2 := EP + pip * 2 * (sell?-1:1)

// current trade direction
LS := buy  or strategy.position_size > 0
SS := sell or strategy.position_size < 0

// adjust trade parameters and trailing stop calculations
TVL := max(TP1,open) - pip[1]
TVS := min(TP1,open) + pip[1]
TSL := open[1] > TSL[1] ? max(TVL,TSL[1]):TVL
TSS := open[1] < TSS[1] ? min(TVS,TSS[1]):TVS

if LS and high > TP1
    if open <= TP1
        SL2:=min(EP,TSL)

if SS and low < TP1
    if open >= TP1
        SL2:=max(EP,TSS)

// Closing conditions
close_long  = LS and open < SL2
close_short = SS and open > SL2

// Buy
strategy.entry("buy"  , strategy.long, when=buy and not SS)
strategy.exit ("exit1", from_entry="buy", stop=SL1, limit=TP1, qty_percent=1)
strategy.exit ("exit2", from_entry="buy", stop=SL2, limit=TP2)

// Sell
strategy.entry("sell" , strategy.short, when=sell and not LS)
strategy.exit ("exit3", from_entry="sell", stop=SL1, limit=TP1, qty_percent=1)
strategy.exit ("exit4", from_entry="sell", stop=SL2, limit=TP2)

// Plots
a=plot(strategy.position_size >  0 ? SL1 : na, color=#dc143c, style=plot.style_linebr)
b=plot(strategy.position_size <  0 ? SL1 : na, color=#dc143c, style=plot.style_linebr)
c=plot(strategy.position_size >  0 ? TP1 : na, color=#00ced1, style=plot.style_linebr)
d=plot(strategy.position_size <  0 ? TP1 : na, color=#00ced1, style=plot.style_linebr)
e=plot(strategy.position_size >  0 ? TP2 : na, color=#00ced1, style=plot.style_linebr)
f=plot(strategy.position_size <  0 ? TP2 : na, color=#00ced1, style=plot.style_linebr)
g=plot(strategy.position_size >= 0 ? na  : EP, color=#ffffff, style=plot.style_linebr)
h=plot(strategy.position_size <= 0 ? na  : EP, color=#ffffff, style=plot.style_linebr)

plot(ema,title="ema",color=#fff176)
plot(wma,title="wma",color=#00ced1)