Stratégie de divergence de la moyenne mobile

Auteur:ChaoZhang est là., Date: 2024-01-24 11:43:41 Je suis désolé
Les étiquettes:

img

Résumé

Cette stratégie détecte les divergences entre le prix et la ligne moyenne mobile et les utilise comme signaux d'achat et de vente. Elle peut être appliquée à n'importe quel oscillateur pour trouver des divergences.

La logique de la stratégie

  1. Calculer la moyenne mobile (MA) de la longueur Len
  2. Détecter les points pivot bas (PL) et pivot haut (PH) de l'AM
  3. Vérifiez la divergence haussière: le prix atteint un nouveau plus bas mais pas le MA ou le MA atteint un nouveau plus bas mais pas le prix
  4. Vérifiez la divergence baissière: le prix atteint un nouveau sommet mais pas l' MA ou l' MA atteint un nouveau sommet mais pas le prix
  5. Achat et vente basés sur la divergence

Analyse des avantages

  1. Détecter automatiquement les divergences entre le prix et l'AM, éviter les erreurs de jugement manuelles
  2. Applicable à n'importe quel oscillateur, forte extensibilité
  3. Peut être utilisé pour vérifier et valider la rentabilité
  4. Paramètres configurables pour régler la sensibilité et éviter les faux signaux
  5. Fournir plusieurs types de divergence pour un jugement précis et complet

Analyse des risques

  1. Les réglages d'oscillateur non valides peuvent générer des faux signaux excessifs
  2. Les points de pivotement valides sont nécessaires avant que la divergence ne se produise, les signaux peuvent être insuffisants
  3. Besoin d'ajuster les paramètres pour équilibrer la sensibilité et filtrer les faux signaux
  4. Fonctionne mieux en combinaison avec d'autres facteurs, confiance relativement faible lorsqu'il est utilisé seul

Directions d'optimisation

  1. Optimiser les paramètres MA pour trouver les meilleures combinaisons de paramètres
  2. Combinez avec d' autres indicateurs comme le volume pour éviter les faux signaux
  3. Ajouter un modèle d'apprentissage automatique pour juger de la crédibilité de la divergence
  4. Ajouter des mécanismes de gestion des risques au contrôle des pertes par transaction

Résumé

Cette stratégie utilise les divergences entre le prix et le MA comme signaux de trading pour éviter les erreurs subjectives. Elle peut être largement appliquée à n'importe quel oscillateur avec une forte extensibilité.


/*backtest
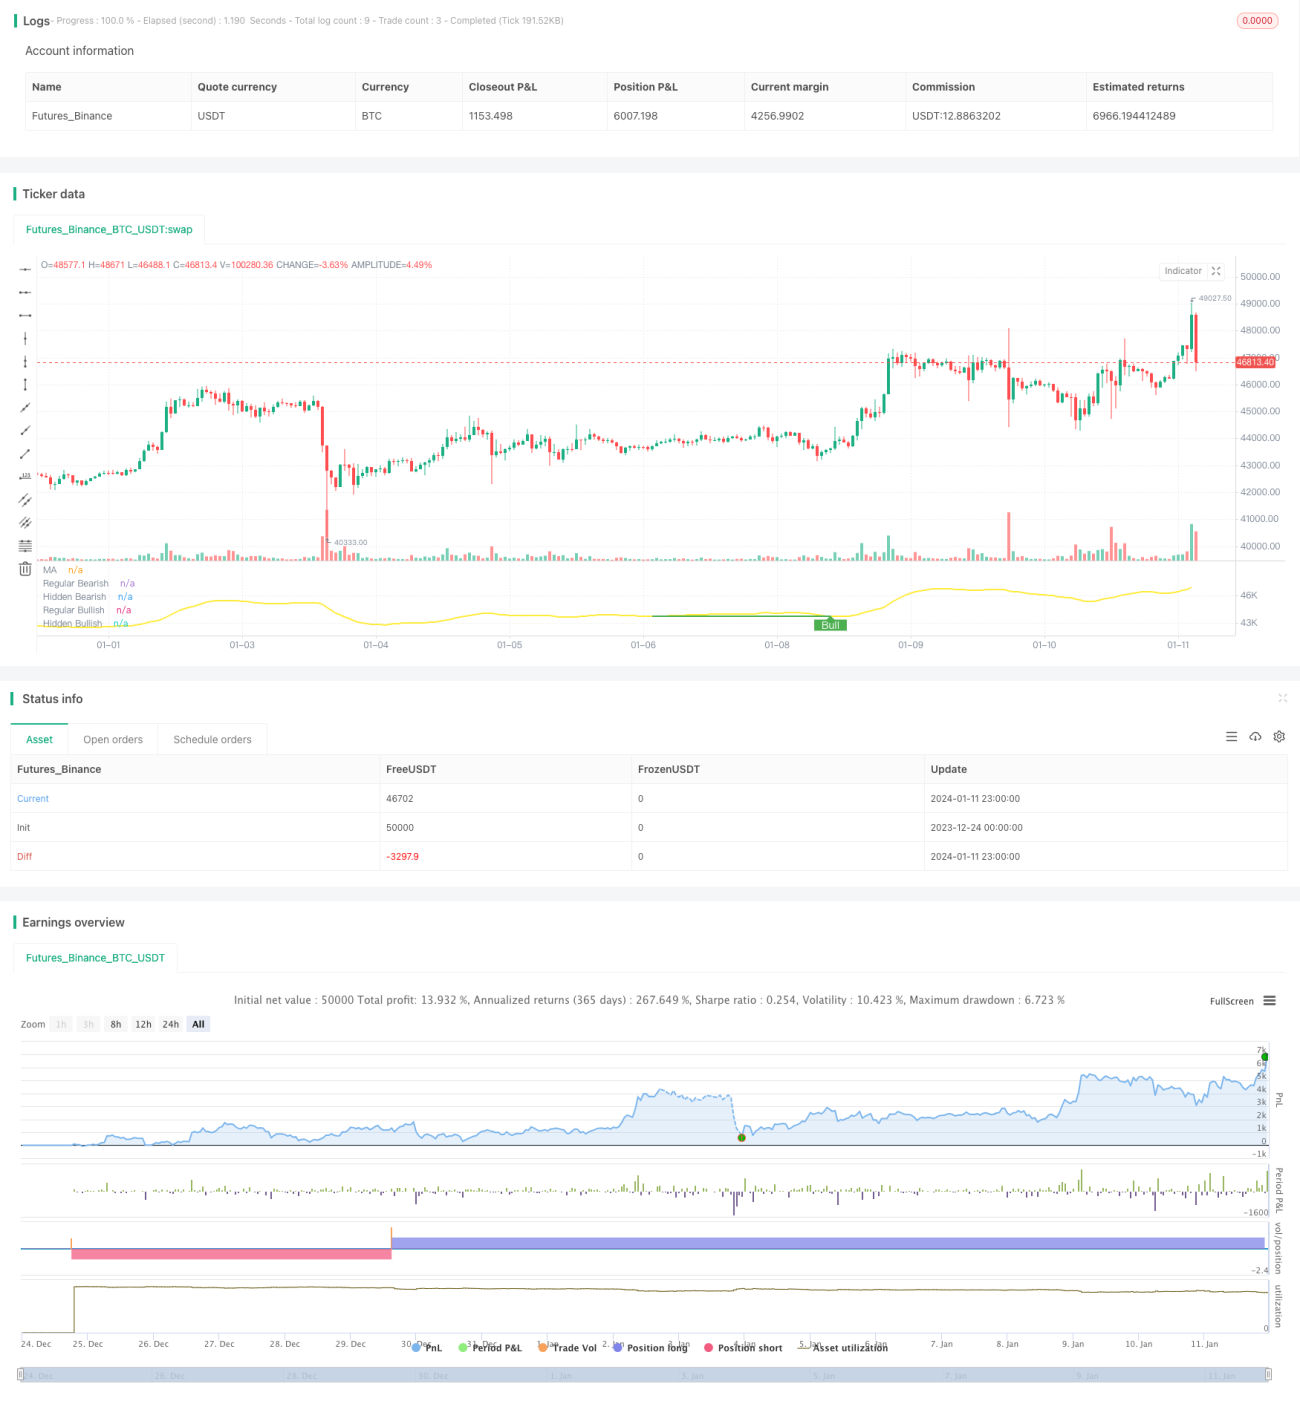
start: 2023-12-24 00:00:00
end: 2024-01-12 00:00:00
period: 1h
basePeriod: 15m
exchanges: [{"eid":"Futures_Binance","currency":"BTC_USDT"}]
*/

// This source code is subject to the terms of the Mozilla Public License 2.0 at https://mozilla.org/MPL/2.0/
// © tista 
//https://www.tradingview.com/u/tista/#published-scripts

//@version=4

strategy(title="MA Divergences", format=format.price)

//* Backtesting Period Selector | Component *//
//* https://www.tradingview.com/script/eCC1cvxQ-Backtesting-Period-Selector-Component *//
//* https://www.tradingview.com/u/pbergden/ *//
//* Modifications made *//
testStartYear = input(2021, "Backtest Start Year") 
testStartMonth = input(1, "Backtest Start Month")
testStartDay = input(1, "Backtest Start Day")
testPeriodStart = timestamp(testStartYear,testStartMonth,testStartDay,0,0)

testStopYear = input(999999, "Backtest Stop Year")
testStopMonth = input(9, "Backtest Stop Month")
testStopDay = input(26, "Backtest Stop Day")
testPeriodStop = timestamp(testStopYear,testStopMonth,testStopDay,0,0)

testPeriod() => true
/////////////// END - Backtesting Period Selector | Component ///////////////
len = input(title="MA Period", minval=1, defval=14)
src = input(title="MA Source", defval=close)
lbR = input(title="Pivot Lookback Right", defval=5)
lbL = input(title="Pivot Lookback Left", defval=5)
rangeUpper = input(title="Max of Lookback Range", defval=600)
rangeLower = input(title="Min of Lookback Range", defval=2)
plotBull = input(title="Plot Bullish", defval=true)
plotHiddenBull = input(title="Plot Hidden Bullish", defval=true)
plotBear = input(title="Plot Bearish", defval=true)
plotHiddenBear = input(title="Plot Hidden Bearish", defval=true)

bearColor = color.red
bullColor = color.green
hiddenBullColor = color.green
hiddenBearColor = color.red
textColor = color.white
noneColor = color.new(color.white, 100)

osc = wma(src, len)

plot(osc, title="MA", linewidth=2, color=color.yellow)

plFound = na(pivotlow(osc, lbL, lbR)) ? false : true
phFound = na(pivothigh(osc, lbL, lbR)) ? false : true

_inRange(cond) =>
    bars = barssince(cond == true)
    rangeLower <= bars and bars <= rangeUpper

alertcondition(osc[1] > 100.0 and osc[2] < 100.0, title="MA value crosses over 100.0", message="Check charts for a MA cross over 100.0")
alertcondition(osc[1] < 100.0 and osc[2] > 100.0, title="MA value crosses under 100.0", message="Check charts for a MA cross under 100.0")
alertcondition(osc[1] > -100. and osc[2] < -100.0, title="MA value crosses over -100.0", message="Check charts for a MA cross over -100.0")
alertcondition(osc[1] < -100.0 and osc[2] > -100.0, title="MA value crosses under -100.0", message="Check charts for a MA cross under -100.0")

//------------------------------------------------------------------------------
// Regular Bullish

// Osc: Higher Low
oscHL = osc[lbR] > valuewhen(plFound, osc[lbR], 1) and _inRange(plFound[1])

// Price: Lower Low
priceLL = low[lbR] < valuewhen(plFound, low[lbR], 1)

bullCond = plotBull and priceLL and oscHL and plFound

plot(
	 plFound ? osc[lbR] : na,
	 offset=-lbR,
	 title="Regular Bullish",
	 linewidth=2,
	 color=(bullCond ? bullColor : noneColor),
	 transp=0
	 )

plotshape(
	 bullCond ? osc[lbR] : na,
	 offset=-lbR,
	 title="Regular Bullish Label",
	 text=" Bull ",
	 style=shape.labelup,
	 location=location.absolute,
	 color=bullColor,
	 textcolor=textColor,
	 transp=0
	 )

alertcondition(bullCond, title="Regular bullish divergence in MA found", message="Check charts for a regular bullish divergence found with MA")

//------------------------------------------------------------------------------
// Hidden Bullish

// Osc: Lower Low
oscLL = osc[lbR] < valuewhen(plFound, osc[lbR], 1) and _inRange(plFound[1])

// Price: Higher Low
priceHL = low[lbR] > valuewhen(plFound, low[lbR], 1)

hiddenBullCond = plotHiddenBull and priceHL and oscLL and plFound

plot(
	 plFound ? osc[lbR] : na,
	 offset=-lbR,
	 title="Hidden Bullish",
	 linewidth=2,
	 color=(hiddenBullCond ? hiddenBullColor : noneColor),
	 transp=0
	 )

plotshape(
	 hiddenBullCond ? osc[lbR] : na,
	 offset=-lbR,
	 title="Hidden Bullish Label",
	 text=" H Bull ",
	 style=shape.labelup,
	 location=location.absolute,
	 color=bullColor,
	 textcolor=textColor,
	 transp=0
	 )

alertcondition(hiddenBullCond, title="Hidden bullish divergence in MA found", message="Check charts for a hidden bullish divergence found with MA")

//------------------------------------------------------------------------------
// Regular Bearish

// Osc: Lower High
oscLH = osc[lbR] < valuewhen(phFound, osc[lbR], 1) and _inRange(phFound[1])

// Price: Higher High
priceHH = high[lbR] > valuewhen(phFound, high[lbR], 1)

bearCond = plotBear and priceHH and oscLH and phFound

plot(
	 phFound ? osc[lbR] : na,
	 offset=-lbR,
	 title="Regular Bearish",
	 linewidth=2,
	 color=(bearCond ? bearColor : noneColor),
	 transp=0
	 )

plotshape(
	 bearCond ? osc[lbR] : na,
	 offset=-lbR,
	 title="Regular Bearish Label",
	 text=" Bear ",
	 style=shape.labeldown,
	 location=location.absolute,
	 color=bearColor,
	 textcolor=textColor,
	 transp=0
	 )

alertcondition(bearCond, title="Regular bearish divergence in MA found", message="Check charts for a regular bearish divergence found with MA")

//------------------------------------------------------------------------------
// Hidden Bearish

// Osc: Higher High
oscHH = osc[lbR] > valuewhen(phFound, osc[lbR], 1) and _inRange(phFound[1])

// Price: Lower High
priceLH = high[lbR] < valuewhen(phFound, high[lbR], 1)

hiddenBearCond = plotHiddenBear and priceLH and oscHH and phFound

plot(
	 phFound ? osc[lbR] : na,
	 offset=-lbR,
	 title="Hidden Bearish",
	 linewidth=2,
	 color=(hiddenBearCond ? hiddenBearColor : noneColor),
	 transp=0
	 )

plotshape(
	 hiddenBearCond ? osc[lbR] : na,
	 offset=-lbR,
	 title="Hidden Bearish Label",
	 text=" H Bear ",
	 style=shape.labeldown,
	 location=location.absolute,
	 color=bearColor,
	 textcolor=textColor,
	 transp=0
	 )

// Alerts
//alertcondition(bearCond or hiddenBearCond, title='Bear div', message='Bear div')
//alertcondition(bullCond or hiddenBullCond, title='Bull div', message='Bull div')
//alertcondition(bearCond or bullCond, title='Bull or beal div', message='Bull or bear div') 
//alertcondition(hiddenBearCond or hiddenBullCond, title='Bull or beal div', message='Hidden Bull or bear div') 
//alertcondition(hiddenBearCond or hiddenBullCond or bearCond or bullCond, title='Bull or beal div', message='Any Bull or bear div') 

if testPeriod()
    if bullCond or hiddenBullCond
        strategy.entry("Buy", strategy.long)
    if bearCond or hiddenBearCond
        strategy.entry("Sell", strategy.short)

Plus de