Stratégie de suivi de tendance par moyenne mobile
Aperçu
La stratégie de suivi de tendance des moyennes mobiles est une stratégie de suivi de tendance basée sur l’identification de la direction de la tendance par des moyennes mobiles à long terme et combinée à un filtrage de la zone de fluctuation réelle de la moyenne pour détecter les mouvements erronés. La stratégie utilise les moyennes mobiles indicielles pour déterminer la direction de la tendance, puis utilise la zone de fluctuation réelle de la moyenne pour déterminer si une fausse rupture a été identifiée.
Principe de stratégie
Cette stratégie est basée sur les principes suivants:
- Utilisez une moyenne mobile indicielle pour déterminer la direction de la tendance globale. La longueur de la période prend en compte les lignes K de 200 par défaut.
- Calculer la moyenne de la gamme réelle des 10 lignes K les plus récentes.
- Une tendance à la hausse est décrite lorsque le cours de clôture est supérieur à la moyenne mobile + à la moyenne de la marge réelle.
- Une tendance à la baisse se produit lorsque le cours de clôture est inférieur à la moyenne mobile de la courbe - la courbe de la moyenne réelle.
- Dans une tendance haussière, faites plus; dans une tendance baissière, faites moins.
- La stratégie par défaut consiste à utiliser une moyenne mobile comme ligne de stop. On peut également choisir de l’utiliser comme ligne de stop avec une moyenne mobile inversée et une plage de fluctuation réelle de ±.
Analyse des avantages
Cette stratégie présente les avantages suivants:
- Les moyennes mobiles permettent de détecter les grandes tendances et de filtrer efficacement le bruit des marchés à court terme.
- L’ajout d’une plage de fluctuation moyenne réelle comme condition de filtrage permet d’éviter la production de signaux de négociation dans des conditions de choc, réduisant ainsi les pertes inutiles.
- Une ligne de stop proche de la moyenne mobile ou de sa fourchette inverse permet de s’arrêter rapidement et de réduire le maximum de rétractation.
- Les paramètres sont simples, faciles à comprendre et à régler.
Analyse des risques
Cette stratégie comporte aussi des risques potentiels:
- Dans un système linéaire, il y a généralement un certain recul lorsque la tendance est inversée.
- Les paramètres des moyennes mobiles et des moyennes réelles ont une grande influence sur la performance de la stratégie. Si les paramètres sont mal définis, des opportunités de négociation peuvent être manquées ou des pertes inutiles peuvent être ajoutées.
- La stratégie elle-même ne prend pas en compte la relation entre le prix des actions et le volume des transactions.
Direction d’optimisation
Cette stratégie peut être optimisée dans les domaines suivants:
- Tester différents types de moyennes mobiles pour trouver les paramètres de moyennes mobiles les plus appropriés pour un stock ou une variété particulière.
- Optimiser les paramètres de cycle des moyennes mobiles pour les rendre plus conformes aux caractéristiques des actions ou des variétés négociées.
- Optimiser les paramètres de la gamme de fluctuations réelles moyennes pour trouver la meilleure combinaison de paramètres pour filtrer les oscillations sans perdre la tendance.
- Il a ajouté: “Nous devons augmenter les règles de jugement sur le volume des transactions pour éviter les ruptures inefficaces”.
- Test et comparaison des différentes méthodes de réduction des pertes afin de déterminer la meilleure solution.
Résumer
La stratégie de suivi de la tendance est une stratégie de tendance très simple et pratique dans l’ensemble. Elle a également un bon effet de contrôle des risques. Bien que la stratégie ne prenne pas en compte trop de facteurs, elle nécessite un test et une optimisation minutieux des paramètres et des méthodes de stop-loss, mais elle est globalement une stratégie efficace facile à maîtriser et à ajuster.
/*backtest
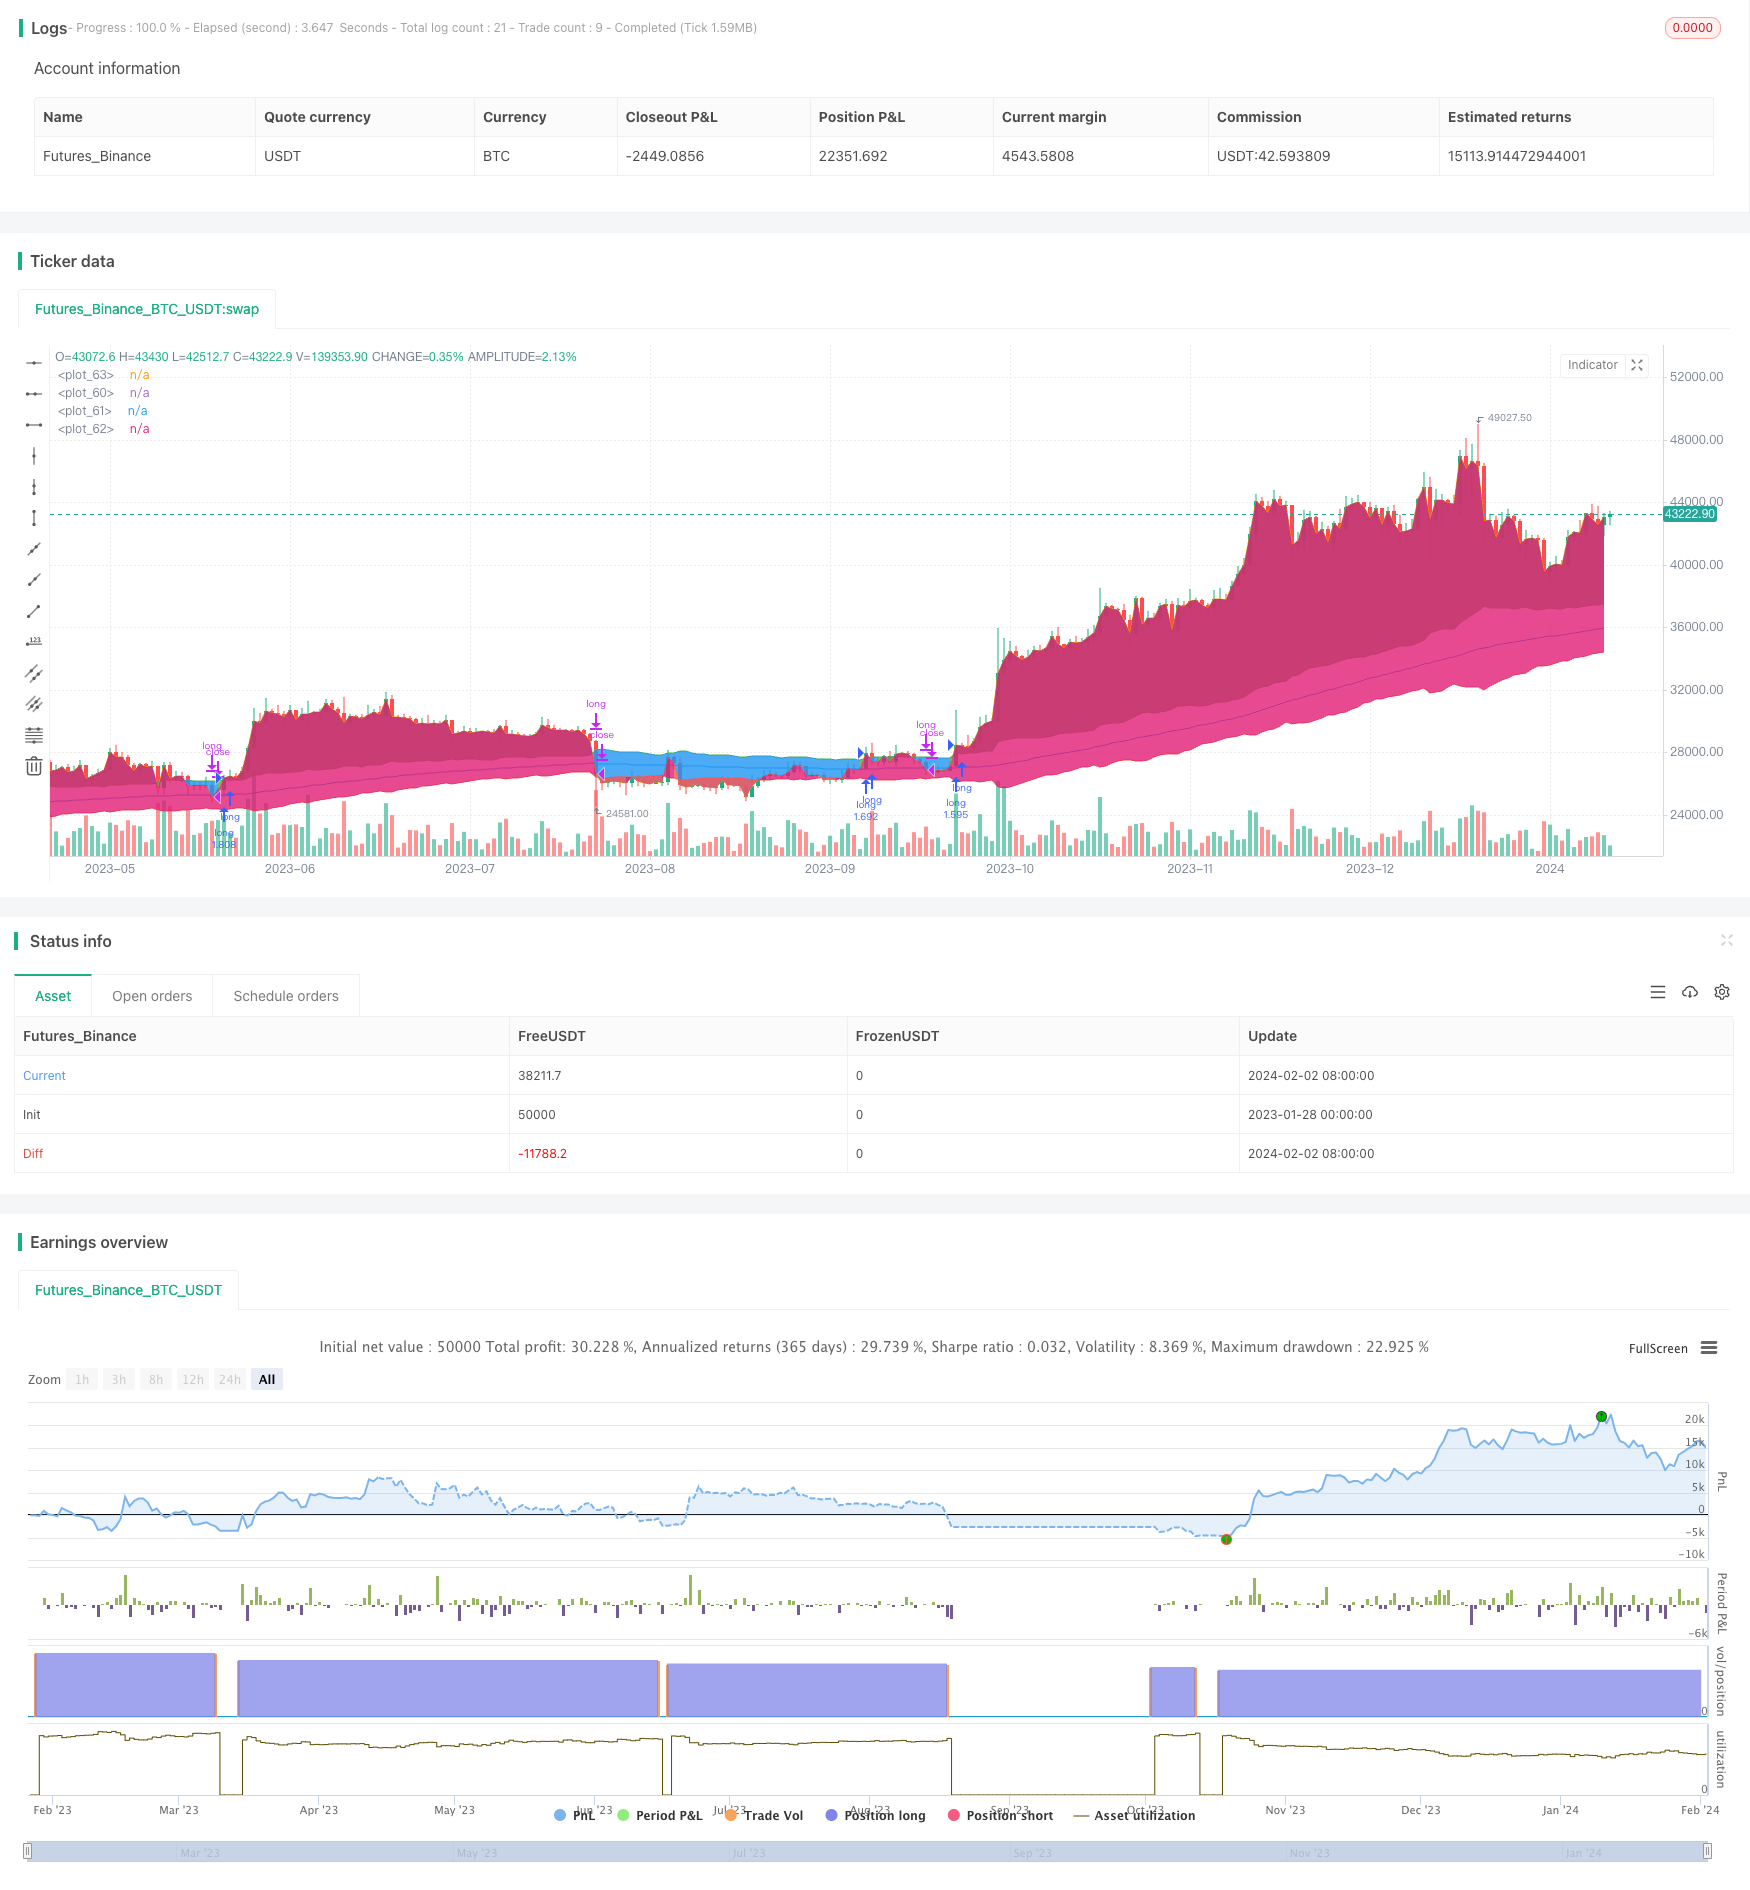
start: 2023-01-28 00:00:00
end: 2024-02-03 00:00:00
period: 1d
basePeriod: 1h
exchanges: [{"eid":"Futures_Binance","currency":"BTC_USDT"}]
*/
// This source code is subject to the terms of the Mozilla Public License 2.0 at https://mozilla.org/MPL/2.0/
// © Inkedlau
//@version=5
strategy('Swing Trend Strategy', overlay=true, pyramiding=1, default_qty_type=strategy.percent_of_equity, default_qty_value=100, initial_capital=1000, commission_value=0.1)
use_short = input.bool(false, 'Open Short Positions?')
exit_type = input.bool(true, 'Exit trade on Moving Average Cross?')
src = input.source(close, 'Source')
len = input.int(200, 'Trend Length')
ma_type = input.string('ema', 'Moving Average Type', options=['sma', 'ema', 'rma', 'wma', 'vwma'], tooltip='Select the type of Moving Average to use to calculate the Trend')
atr_multiplier = input.float(1., 'ATR Threshold', step=0.5, tooltip='Filter the ranging market using the Average True Range')
// ----------------------- DESCRIPTION -----------------------
// THIS SCRIPT IS A TREND FOLLOWING SYSTEM THAT USES A COMBINATION OF MOVING AVERAGE AND AVERAGE TRUE RANGE
// TO SPOT THE TRENDS AND ENTER THE MARKET ACCODINGLY.
// THE MARKET IS CONSIDERED IN AN UPTREND WHEN THE PRICE CLOSES ABOVE THE MOVING AVERAGE + THE AVERAGE TRUE RANGE OF THE LAST 10 PERIODS
// THE MARKET IS CONSIDERED IN AN DOWNTREND WHEN THE PRICE CLOSES BLOW THE MOVING AVERAGE - THE AVERAGE TRUE RANGE OF THE LAST 10 PERIODS
// BY DEFAULT, THE STRATEGY WILL ENTER LONG WHEN AN UPTREND IS SPOTTED, THEN CLOSES WHEN THE PRICE CLOSES BELOW THE MOVING AVERAGE
// THE STRATEGY WILL ENTER SHORT WHEN A DOWNTREND IS SPOTTED, THEN CLOSES WHEN THE PRICE CLOSES ABOVE THE MOVING AVERAGE
// ------------------ INDICATORS CALCULATION------------------
my_ma()=>
ma = close
if ma_type == 'sma'
ma := ta.sma(src, len)
if ma_type == 'ema'
ma := ta.ema(src, len)
if ma_type == 'rma'
ma := ta.rma(src, len)
if ma_type == 'wma'
ma := ta.wma(src, len)
if ma_type == 'vwma'
ma := ta.vwma(src, len)
ma
trend = my_ma()
atr = ta.atr(10)
uptrend = trend + atr * atr_multiplier
downtrend = trend - atr * atr_multiplier
// ---------------- ENTRY AND EXIT CONDITIONS ----------------
open_long = strategy.position_size == 0 and src > uptrend
close_long = exit_type ? strategy.position_size > 0 and src < trend : strategy.position_size > 0 and src < downtrend
open_short = use_short and strategy.position_size == 0 and src < downtrend
close_short = exit_type ? strategy.position_size < 0 and src > trend : strategy.position_size < 0 and src > uptrend
strategy.entry('long', strategy.long, when=open_long)
strategy.close('long', when=close_long)
strategy.entry('short', strategy.short, when=open_short)
strategy.close('short', when=close_short)
// ------------------ PLOTTING AND COLORING ------------------
tcolor = src > uptrend ? color.green : src < downtrend ? color.red : na
ptrend = plot(trend, color=color.blue, linewidth=1)
puptrend = plot(uptrend, color=color.green, linewidth=1)
pdowntrend = plot(downtrend, color=color.red, linewidth=1)
pclose = plot(close, color=na)
fill(puptrend, pclose, color=close > uptrend ? color.green : na, transp = 90)
fill(pdowntrend, pclose, color=close < downtrend ? color.red : na, transp = 90)