Stratégie de stop loss suiveur Supertrend basée sur Heikin Ashi
Aperçu de la stratégie
Cette stratégie est une stratégie de suivi de la tendance en combinant le fil de Heikin Ashi et l’indicateur de tendance supérieure. Elle utilise le fil de Heikin Ashi pour filtrer le bruit du marché, l’indicateur de tendance supérieure pour juger de la direction de la tendance et le suivi de la tendance supérieure en tant que ligne d’arrêt dynamique pour un suivi de la tendance efficace et le contrôle du risque.
Principe de stratégie
- Calculer la ligne Heikin Ashi: prix d’ouverture, prix de clôture, prix le plus élevé, prix le plus bas.
- Calculer l’indicateur de super-tendance: calculer le haut et le bas du rail en fonction de l’ATR et du prix.
- La direction de la tendance est déterminée par la combinaison de la ligne Heikin Ashi et de la super tendance.
- Une tendance haussière est une tendance baissière lorsque la clôture de Heikin Ashi est plus proche de la ligne supérieure de la tendance supérieure que la clôture de la ligne K précédente.
- Dans une tendance haussière, le stop-loss est suivi par une super tendance; dans une tendance baissière, le stop-loss est suivi par une super tendance.
Avantages stratégiques
- Le filtrage Heikin Ashi permet de détecter les signaux de tendance de manière plus fiable.
- Les super tendances servent de stop-loss dynamiques pour maximiser les gains de la tendance et éviter les retraits excessifs.
- La combinaison de différentes périodes de temps permet d’évaluer la polyvalence et de confirmer le signal de haute et basse fréquence de manière plus fiable.
- La fonction de réglage de la position en temps réel permet d’éviter l’influence des comportements irrationnels à un moment donné.
Risque stratégique
- Il est facile de s’arrêter lorsque la tendance est inversée. Le risque peut être réduit par un assouplissement approprié de la ligne de stop.
- Une mauvaise configuration des paramètres de super-tendance peut entraîner un arrêt trop large ou trop étroit. Différentes combinaisons de paramètres peuvent être testées.
- La gestion des fonds n’est pas prise en compte.
- Le coût de la transaction n’est pas pris en compte.
Orientation de l’optimisation de la stratégie
- Optimiser les combinaisons de paramètres de la super-tendance pour trouver le paramètre optimal.
- Ajout de fonctionnalités de contrôle de position.
- Ajoutez des considérations de coût, comme les frais de traitement, les points de glissement, etc.
- Le stop loss peut être ajusté en fonction de la force ou de la faiblesse de la tendance.
- Considérez le filtrage des signaux d’entrée en combinaison avec d’autres indicateurs.
Résumer
La stratégie intègre les avantages des deux indicateurs Heikin Ashi et Supertrend, capture la direction de la tendance et utilise les supertrends pour automatiser le suivi dynamique des arrêts de perte et ainsi verrouiller les bénéfices de la tendance. Les risques de la stratégie proviennent principalement du renversement de tendance et de l’optimisation des paramètres, qui peuvent être améliorés par une optimisation supplémentaire.
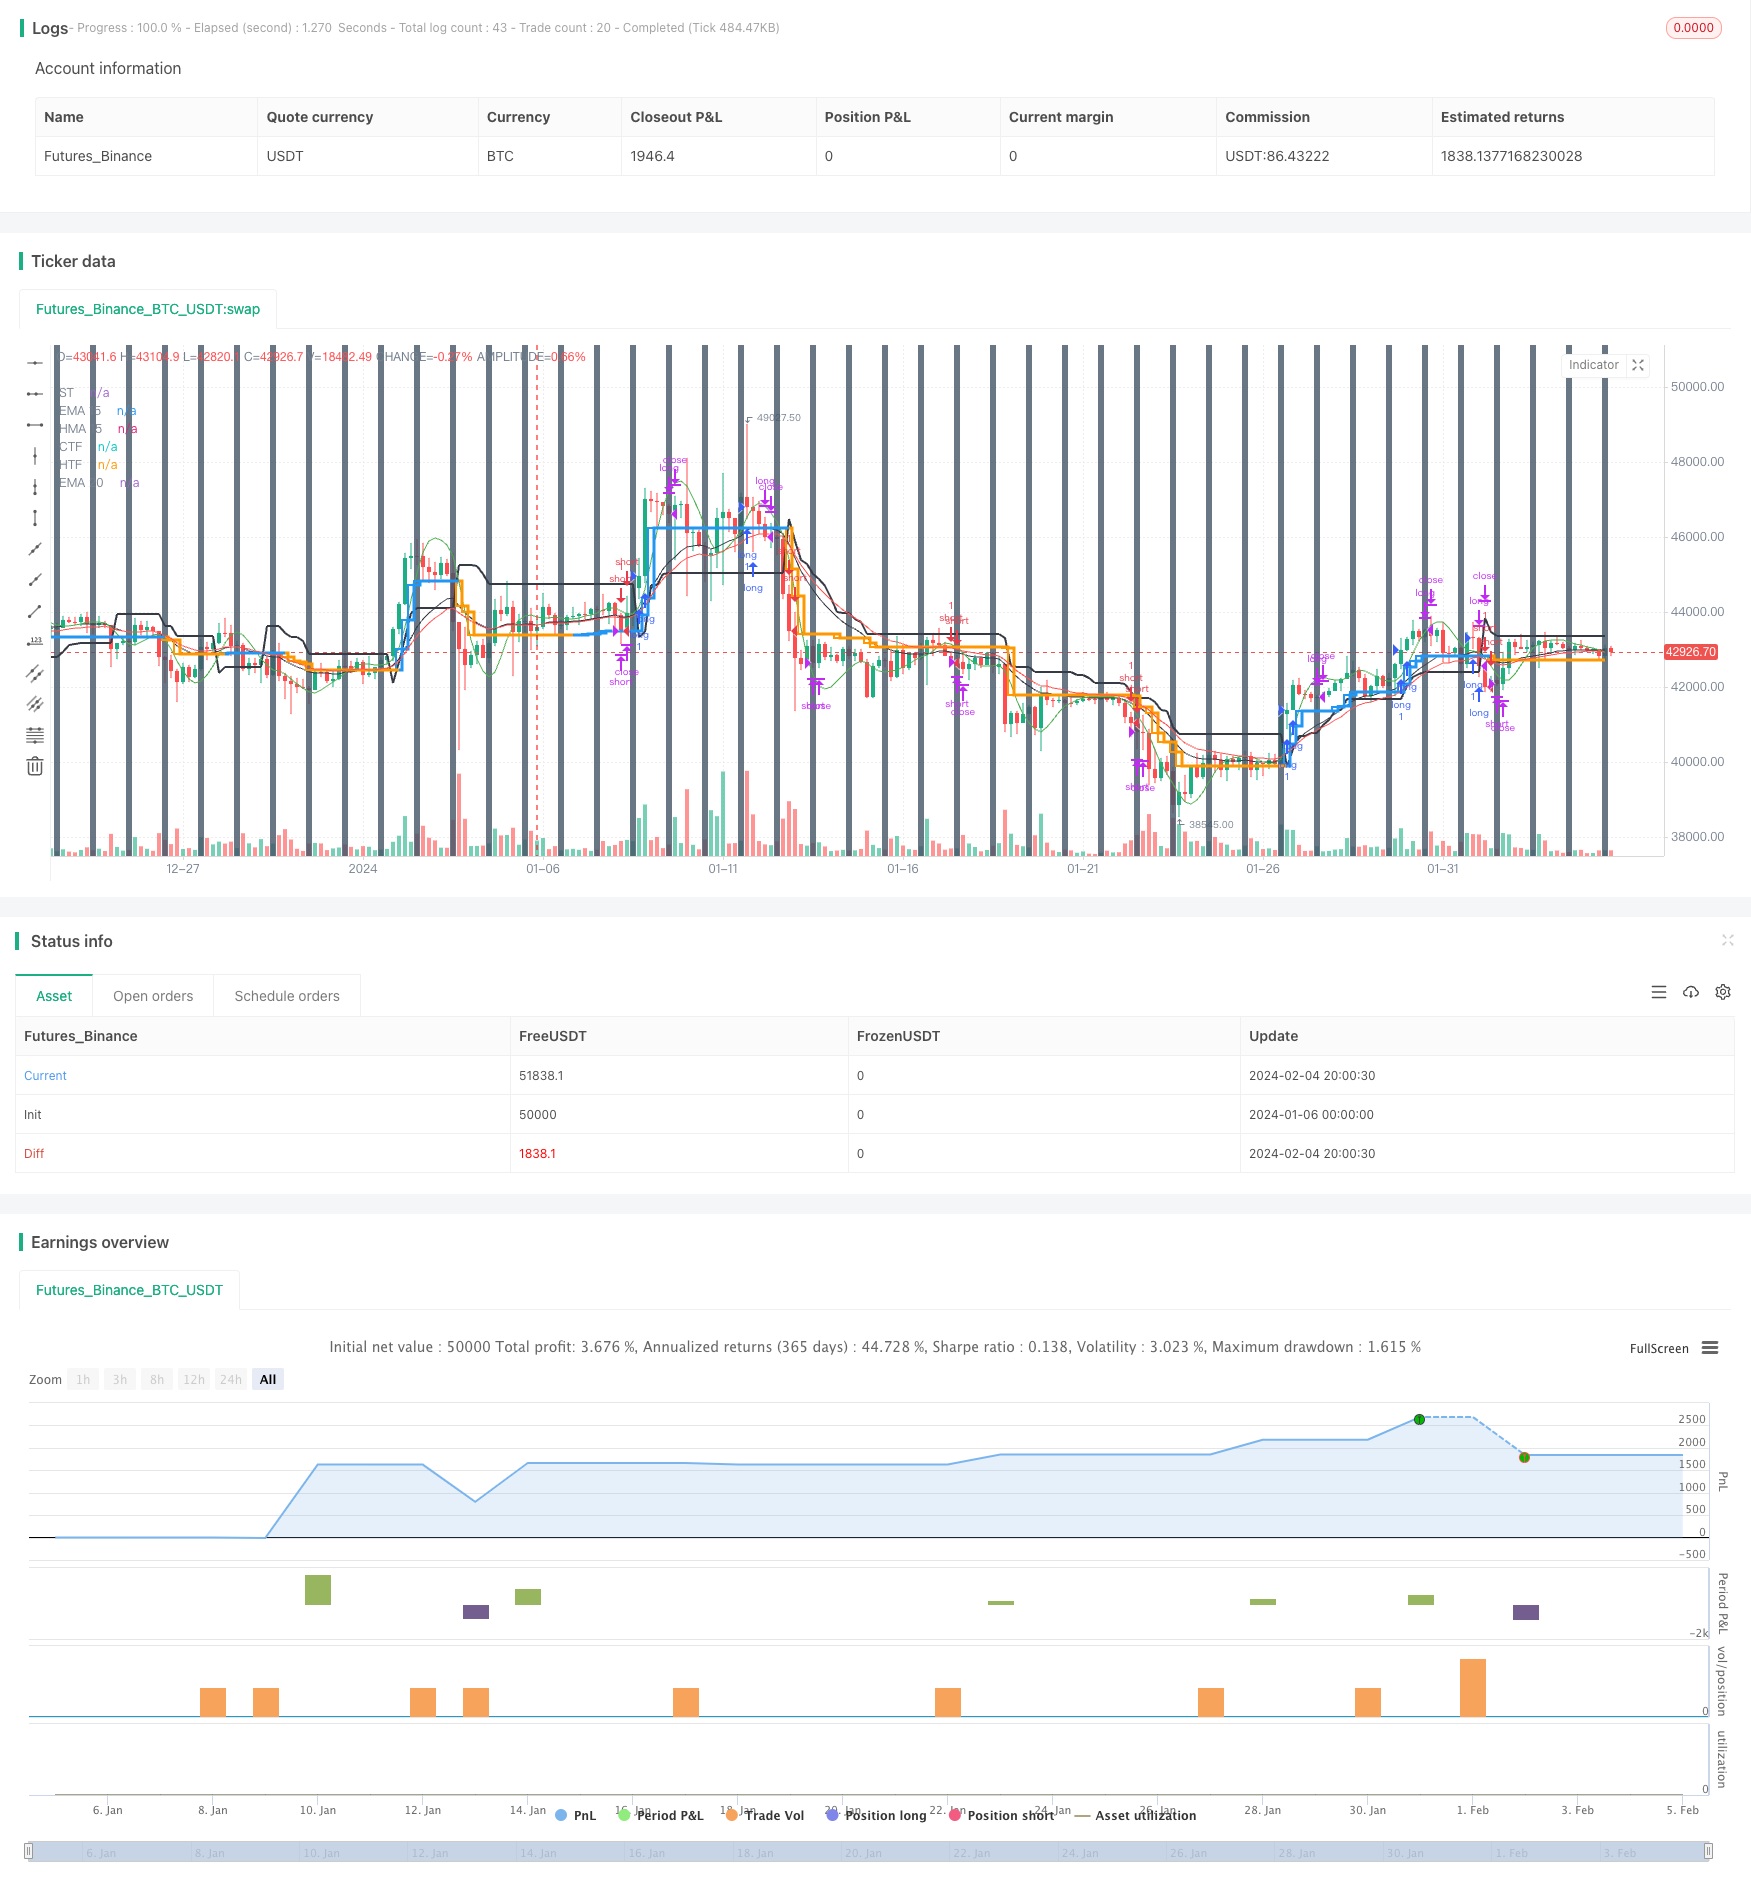
/*backtest
start: 2024-01-06 00:00:00
end: 2024-02-05 00:00:00
period: 4h
basePeriod: 15m
exchanges: [{"eid":"Futures_Binance","currency":"BTC_USDT"}]
*/

// This source code is subject to the terms of the Mozilla Public License 2.0 at https://mozilla.org/MPL/2.0/
// © ringashish

//@version=4
strategy("sa-strategy with HTF-TSL", overlay=true)


Pd = input(title="ATR Period", type=input.integer, defval=4)
Factor = input(title="ATR Multiplier", type=input.float, step=0.1, defval=2)
ST= supertrend(Factor, Pd)

heikinashi_close = security(heikinashi(syminfo.tickerid), timeframe.period, close)
heikinashi_low = security(heikinashi(syminfo.tickerid), timeframe.period, low)
heikinashi_open = security(heikinashi(syminfo.tickerid), timeframe.period, open)
heikinashi_high = security(heikinashi(syminfo.tickerid), timeframe.period, high)

heikinashi_close30 = security(heikinashi(syminfo.tickerid), "30", close)
//res1 = input("30", type=input.resolution, title="higher Timeframe")


//CCI TSL

res = input("240",type=input.resolution,title = "Higher Time Frame")
CCI = input(20)
ATR = input(5)
Multiplier=input(1,title='ATR Multiplier')
original=input(false,title='original coloring')
thisCCI = cci(close, CCI)
lastCCI = nz(thisCCI[1])


calcx()=>
    bufferDn= high + Multiplier * sma(tr,ATR)
    bufferUp= low - Multiplier * sma(tr,ATR)
    if (thisCCI >= 0 and lastCCI < 0)
        bufferUp := bufferDn[1]
    if (thisCCI <= 0 and lastCCI > 0)
        bufferDn := bufferUp[1]

    if (thisCCI >= 0)
        if (bufferUp < bufferUp[1])
            bufferUp := bufferUp[1]
    else
        if (thisCCI <= 0)
            if (bufferDn > bufferDn[1])
                bufferDn := bufferDn[1]


    x = 0.0
    x := thisCCI >= 0 ?bufferUp:thisCCI <= 0 ?bufferDn:x[1]
    x

tempx = calcx()

calcswap() =>
    swap = 0.0
    swap := tempx>tempx[1]?1:tempx<tempx[1]?-1:swap[1]
    swap

tempswap = calcswap()

swap2=tempswap==1?color.blue:color.orange
swap3=thisCCI >=0 ?color.blue:color.orange
swap4=original?swap3:swap2

//display current timeframe's Trend

plot(tempx,"CTF",color=swap4,transp=0,linewidth=2, style = plot.style_stepline)


htfx = security(syminfo.tickerid,res,tempx[1],lookahead = barmerge.lookahead_on)
htfswap4 = security(syminfo.tickerid,res,swap4[1],lookahead = barmerge.lookahead_on)

plot(htfx,"HTF",color=htfswap4,transp=0,linewidth=3,style = plot.style_stepline)


//supertrend
Supertrend(Factor, Pd) =>
    Up=hl2-(Factor*atr(Pd))
    Dn=hl2+(Factor*atr(Pd))

    TrendUp = 0.0
    TrendUp := heikinashi_close[1]>TrendUp[1] ? max(Up,TrendUp[1]) : Up
    TrendDown = 0.0
    TrendDown := heikinashi_close[1]<TrendDown[1]? min(Dn,TrendDown[1]) : Dn
    Trend = 0.0
    Trend := heikinashi_close > TrendDown[1] ? 1: heikinashi_close< TrendUp[1]? -1: nz(Trend[1],1)
    Tsl = Trend==1? TrendUp: TrendDown

    S_Buy = Trend == 1 ? 1 : 0
    S_Sell = Trend != 1 ? 1 : 0

    [Trend, Tsl]

[Trend,Tsl] = Supertrend(Factor, Pd)
// Security
//ST1_Trend_MTF = security(syminfo.tickerid, res1, Tsl,barmerge.lookahead_on)
//plot(ST1_Trend_MTF, "higher ST")

crossdn = crossunder(heikinashi_close,Tsl) or crossunder(heikinashi_close[1],Tsl) or crossunder(heikinashi_close[2],Tsl) or heikinashi_close < Tsl
crossup = crossover(heikinashi_close,Tsl) or crossover(heikinashi_close[1],Tsl) or crossover(heikinashi_close[2],Tsl) or heikinashi_close > Tsl
plot(Tsl,"ST",color = color.black,linewidth =2)
plot(ema(heikinashi_close,20),"EMA 20",color=color.red)
plot(hma(heikinashi_close,15),"HMA 15",color=color.green)
plot(ema(heikinashi_close,15),"EMA 15",color=color.black)

closedown = (heikinashi_close < hma(heikinashi_close,15) and heikinashi_high > hma(heikinashi_close,15)) or(heikinashi_close < ema(heikinashi_close,20) and heikinashi_high > ema(heikinashi_close,20))
closeup = (heikinashi_close > hma(heikinashi_close,15) and heikinashi_low < hma(heikinashi_close,15)) or (heikinashi_close > ema(heikinashi_close,20) and heikinashi_low < ema(heikinashi_close,20))

buy = heikinashi_open == heikinashi_low and closeup and crossup  and close > htfx
//buy = heikinashi_open == heikinashi_low and heikinashi_close > ema(close,20) and heikinashi_low < ema(close,20) and crossup
buyexit = cross(close,tempx) //heikinashi_open == heikinashi_high //and heikinashi_close < ema(close,15) and heikinashi_high > ema(close,15)

//if heikinashi_close30[1] < ST1_Trend_MTF
//sell = heikinashi_open == heikinashi_high and heikinashi_close < ema(close,20) and heikinashi_high > ema(close,20) and rsi(close,14)<60 and crossdn
sell = heikinashi_open == heikinashi_high and closedown and rsi(close,14)<55 and crossdn  and close < htfx
sellexit = cross(close,tempx) //heikinashi_open == heikinashi_low //and heikinashi_close > ema(close,15) and heikinashi_low < ema(close,15)

rg = 0
rg := buy ? 1 : buyexit ? 2 : nz(rg[1])

longLogic = rg != rg[1] and rg == 1
longExit = rg != rg[1] and rg == 2

//plotshape(longExit,"exit buy",style = shape.arrowup,location = location.belowbar,color = color.red, text ="buy exit", textcolor = color.red)
//plotshape(longLogic,"BUY",style = shape.arrowup,location = location.belowbar,color = color.green, text ="buy", textcolor= color.green)

nm = 0
nm := sell ? 1 : sellexit ? 2 : nz(nm[1])

shortLogic = nm != nm[1] and nm == 1
shortExit = nm != nm[1] and nm == 2

//plotshape(shortExit,"exit sell",style = shape.arrowup,location = location.belowbar,color = color.red, text ="sell exit", textcolor = color.red)
//plotshape(shortLogic,"SELL",style = shape.arrowup,location = location.belowbar,color = color.green, text ="sell", textcolor= color.green)


//Exit at particular time

ExitHour = input(title="Exit Hour Of Day", type=input.integer, defval=15, step = 5, maxval = 24, minval = 0)
ExitMint = input(title="Exit Minute Of Day", type=input.integer, defval=15, step = 5, maxval = 24, minval = 0)
bgc = input(title="Highlight Background Color?", type=input.bool, defval=true)
mRound(num,rem) => (floor(num/rem)*rem)
exitTime = (hour(time) >= ExitHour and (minute == mRound(ExitMint, timeframe.multiplier))) ? 1 : 0
exitTime := exitTime == 0 ? (hour(time) >= ExitHour and (minute + timeframe.multiplier >= ExitMint)) ? 1 : 0 : exitTime

MarketClose =  exitTime and not exitTime[1]

alertcondition(exitTime and not exitTime[1], title="Intraday Session Close Time", message="Close All Positions")
bgcolor(exitTime and not exitTime[1] and bgc ? #445566 : na, transp =40)


longCondition = longLogic
if (longCondition)
    strategy.entry("long", strategy.long)


shortCondition = shortLogic
if (shortCondition)
    strategy.entry("short", strategy.short)


strategy.close("short", when =cross(close,tempx)  or MarketClose)
strategy.close( "long", when =cross(close,tempx) or MarketClose )