Stratégie de suivi adaptatif du profil d'oscillation à plusieurs échelles de temps

Aperçu
La stratégie utilise le filtre Hodrick-Prescott, HP pour lisser les prix, extraire les lignes de tendance des prix. Ensuite, calculer une moyenne pondérée personnalisée des prix basée sur une période définie par l'utilisateur.
Principe de stratégie
-
Le filtre HP extrait les lignes de tendance des prix. Le filtre HP extrait les composants de tendance à long terme des prix par des méthodes d'optimisation, en éliminant les perturbations de la volatilité à court terme.
-
Le VWAP est calculé sur la base d'une plage de temps personnalisée par l'utilisateur. Le VWAP reflète plus précisément les prix moyens sur différentes périodes.
-
Les conditions de multiplication sont remplies lorsque le prix est au-dessus de la ligne de tendance de HP; les conditions de blanchiment sont remplies lorsque le prix est au-dessous de la ligne de tendance de HP. Ainsi, il est possible de capturer une rupture du prix vers le haut ou une rupture vers le bas.
-
ATR est un système d'arrêt des pertes combiné à des risques raisonnables pour éviter des pertes excessives.
Analyse des avantages
-
Le filtre HP est utilisé pour extraire la tendance des prix, et est plus lisse que les indicateurs tels que MA, afin d'éviter d'être induit en erreur par les fluctuations de prix à court terme.
-
Les cycles VWAP personnalisés permettent une plus grande flexibilité pour s'adapter aux changements des cycles du marché.
-
Le trading selon la direction de la tendance est conforme à la philosophie du trading tendance et a un taux de réussite plus élevé.
-
ATR arrête les pertes pour contrôler les pertes individuelles et éviter les pertes excessives.
-
Les paramètres peuvent être modifiés et optimisés pour différents marchés.
Risques et contre-mesures
-
Il peut y avoir un arrêt de perte lors d'une compilation de disque de vibration.
-
Au terme d'une tendance, le ClientRawResponse est souvent confronté à une rupture de la détection de redémarrage.
-
Une mauvaise configuration du cycle VWAP peut faire passer à côté d'opportunités de trading plus efficaces. Le cycle VWAP doit être ajusté en fonction de la dynamique de l'indicateur de tendance.
Direction d'optimisation
-
Le paramètre du filtre HP λ peut ajuster l'intensité de l'élasticité. La valeur de λ est plus grande lorsque la ligne de tendance est plus lisse, ce qui est plus propice à la capture de la tendance de la ligne longue. La valeur de λ est plus sensible à l'heure en réponse aux changements de prix, ce qui est mieux adapté pour capturer les opportunités de courte ligne moyenne.
-
Le coefficient ATR permet d'ajuster la portée des arrêts. Il est compatible avec l'optimisation des paramètres de λ, les valeurs de λ étant plus élevées pour élargir la portée des arrêts de manière appropriée; les valeurs de λ étant plus petites, la portée des arrêts peut être réduite pour verrouiller plus de bénéfices.
-
Le rapport R:R influe directement sur le rapport profit/perte. Le contrôle de rétractation et la rentabilité peuvent être testés dans des multiples différents.
Résumer
La stratégie est conçue pour suivre les tendances. Elle permet d'optimiser les paramètres en fonction de périodes de temps différentes. Elle offre de meilleures chances de réussite et de rentabilité.
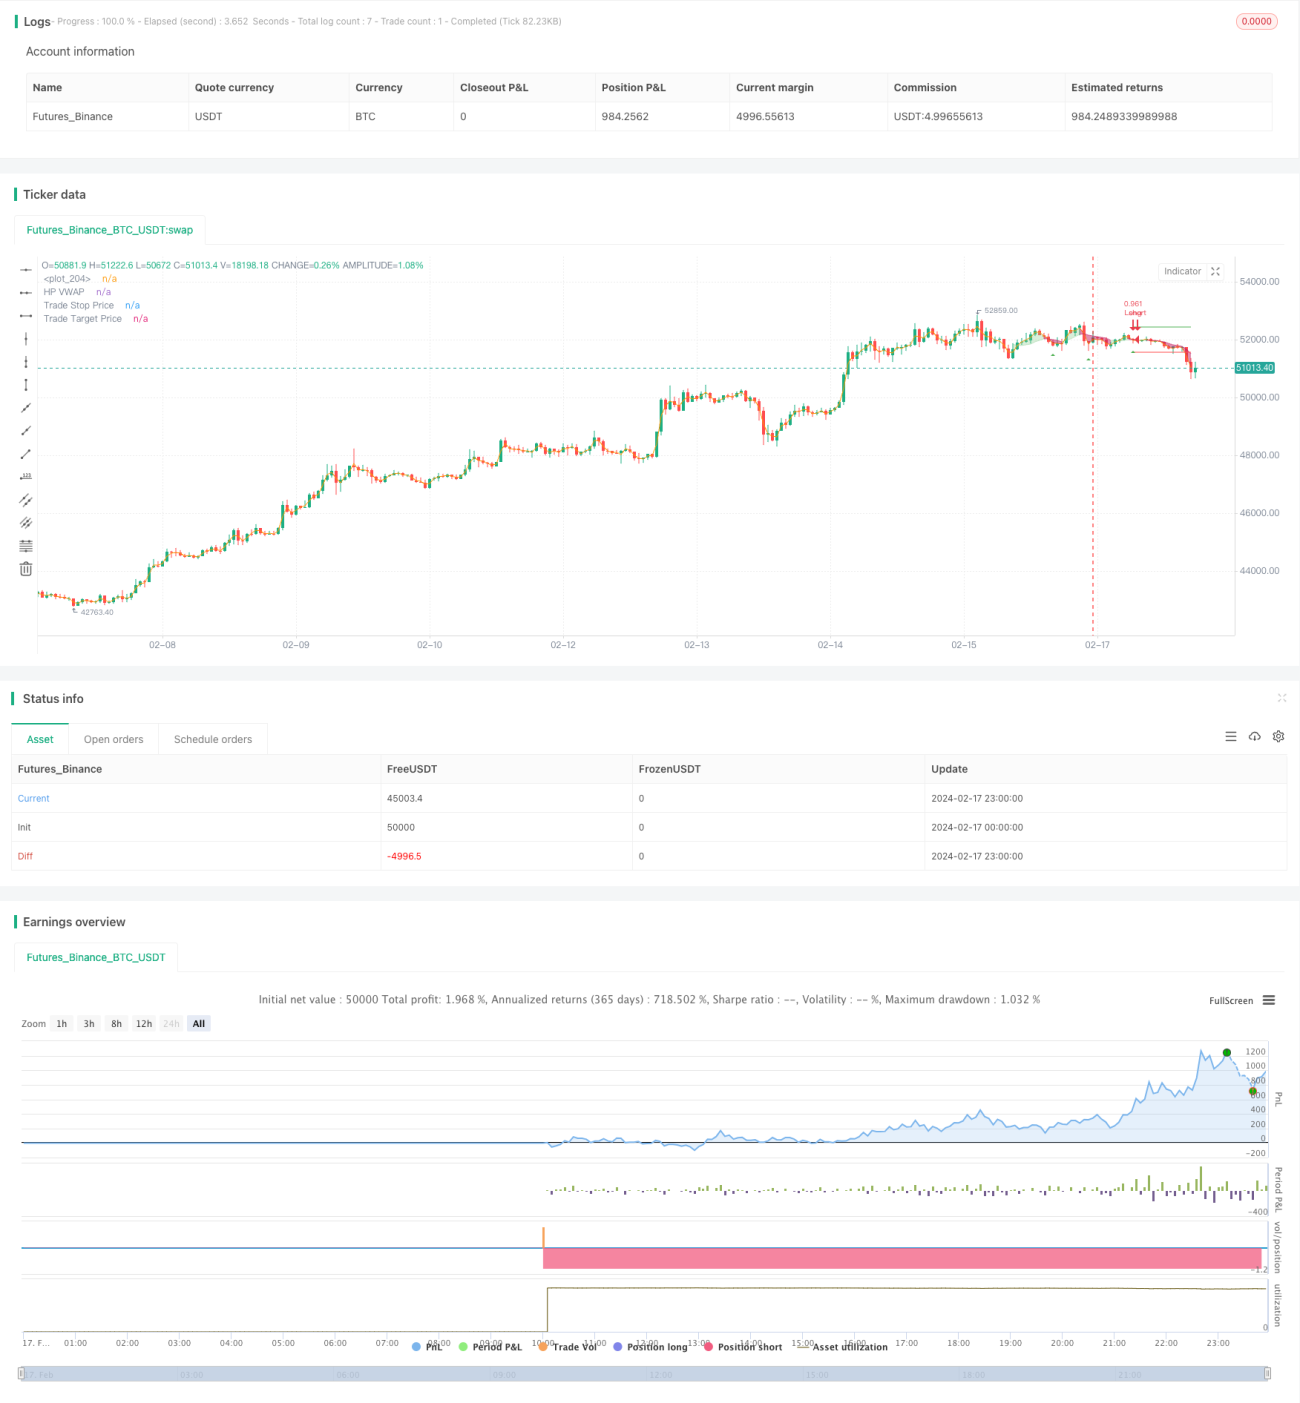
/*backtest
start: 2024-02-17 00:00:00
end: 2024-02-18 00:00:00
period: 1h
basePeriod: 15m
exchanges: [{"eid":"Futures_Binance","currency":"BTC_USDT"}]
*/

// This source code is subject to the terms of the Mozilla Public License 2.0 at https://mozilla.org/MPL/2.0/
// © tathal animouse hajixde

//@version=4- 1