टीएफओ और एटीआर पर आधारित ट्रेंड-फॉलोइंग स्टॉप-लॉस रणनीति

अवलोकन
यह रणनीति एक ट्रेंड ट्रैकिंग स्टॉप-लॉस रणनीति है, जो डॉ. जॉन एहलर्स के ट्रेंड फ्लेक्स ऑसिलेटर (टीएफओ) और औसत सच्ची रेंज (एटीआर) पर आधारित है। यह मल्टीहेड मार्केट के लिए है, जो ओवरसोल्ड के बाद कीमतों में उलटफेर होने पर मल्टीहेड पोजीशन खोलता है। यह आमतौर पर कुछ दिनों के भीतर पोजीशन को साफ कर देता है, जब तक कि इसे भालू बाजार में नहीं पकड़ा जाता है, इस स्थिति में यह स्थिति को बरकरार रखता है। यह रणनीति सरल रिटर्न के माध्यम से विन्यास योग्य मापदंडों को समायोजित करती है, लेकिन रिटर्न के परिणामों पर पूरी तरह से भरोसा नहीं किया जाना चाहिए।
रणनीति सिद्धांत
इस रणनीति में टीएफओ और एटीआर दोनों को शामिल किया गया है, जो खरीदने के लिए और बेचने के लिए उपयुक्त है।
खरीदने की शर्तेंः जब टीएफओ किसी थ्रेशोल्ड से कम हो (अधिक खालीपन को दर्शाता है) और शीर्ष के लाइन का टीएफओ वर्तमान के लाइन से कम है (टीएफओ को उलटने के लिए ऊपर की ओर) और एटीआर निर्धारित उतार-चढ़ाव थ्रेशोल्ड से अधिक है (बाजार में उतार-चढ़ाव को बढ़ाने के लिए), तो इन तीन शर्तों को पूरा करने के लिए अधिक स्थान खोलें।
सम स्थिति की शर्तें: जब टीएफओ एक निश्चित थ्रेशोल्ड से अधिक होता है (अधिक ओवरहेड का संकेत देता है) और एटीआर सेट थ्रेशोल्ड से अधिक होता है, तो सभी अधिक पदों को समाप्त कर दिया जाता है। इसके अलावा, रणनीति ट्रैक स्टॉप लॉस सेट करती है, और जब कीमत सेट ट्रैक स्टॉप लॉस मूल्य से नीचे आती है, तो सभी अधिक पदों को भी समाप्त कर दिया जाता है। उपयोगकर्ता चुन सकते हैं कि रणनीति को सूचक सिग्नल के आधार पर या केवल मूल्य के आधार पर बंद कर दिया जाए।
इस रणनीति में एक ही समय में 15 से अधिक पदों को खोला जा सकता है। इसके पैरामीटर को विभिन्न समय अवधि के लिए समायोजित किया जा सकता है।
रणनीतिक लाभ
-
प्रवृत्ति और अस्थिरता के साथ बाजार की दिशा का निर्धारण करने के लिए, यह अपेक्षाकृत स्थिर है। टीएफओ प्रवृत्ति को तोड़ने के शुरुआती संकेतों को पकड़ सकता है, एटीआर बाजार में उतार-चढ़ाव के समय को पकड़ सकता है।
-
समायोज्य खरीद और बिक्री पैरामीटर और स्टॉप-लॉस पैरामीटर सेट करें। उपयोगकर्ता बाजार के आधार पर पैरामीटर को समायोजित कर सकते हैं और अनुकूलन प्राप्त कर सकते हैं।
-
एक अंतर्निहित स्टॉप लॉस फ़ंक्शन है जो चरम स्थितियों में नुकसान को कम करता है। स्टॉप लॉस रणनीतियों को क्वांटिफाइड ट्रेडिंग में एक महत्वपूर्ण हिस्सा माना जाता है।
-
अतिरिक्त खोलने और आंशिक रूप से बंद करने का समर्थन करें, जो कि अधिक से अधिक पदों के माध्यम से मुनाफे को बढ़ा सकता है।
रणनीतिक जोखिम
-
यह रणनीति केवल अधिक काम करती है, खाली नहीं होती है और गिरते बाजारों में लाभ नहीं ले सकती है। यदि यह एक भयानक भालू बाजार में होता है, तो यह भारी नुकसान का कारण बन सकता है।
-
अनुचित पैरामीटर सेट करने से ओवर-ट्रेडिंग या ओवर-बिक्री हो सकती है। सर्वोत्तम पैरामीटर संयोजन खोजने के लिए बार-बार परीक्षण की आवश्यकता होती है।
-
चरम स्थितियों में, रोकथाम प्रभावहीन हो सकता है और बड़े नुकसान को रोकने में असमर्थ हो सकता है। यह सभी रोकथाम रणनीतियों के लिए एक समस्या है।
-
यह रिटर्न्स पूरी तरह से वास्तविक लेनदेन की स्थिति को प्रतिबिंबित नहीं करते हैं, और वास्तविक लेनदेन के परिणामों में कुछ विचलन हो सकता है।
रणनीति अनुकूलन
-
बिक्री की शर्तों में एक चलती स्टॉप लाइन को शामिल करने पर विचार किया जा सकता है, ताकि रणनीति समय पर बंद हो जाए और नीचे जाने के जोखिम को प्रभावी ढंग से नियंत्रित किया जा सके।
-
इस रणनीति को खाली बाजारों के लिए लागू करने के लिए, TFO रिवर्स गिरावट और एटीआर पर्याप्त होने पर एक खाली स्थिति खोलने के लिए एक शून्य-निष्क्रियता तंत्र का विस्तार किया जा सकता है।
-
अतिरिक्त फ़िल्टरिंग शर्तें जोड़ी जा सकती हैं, जैसे कि लेन-देन में परिवर्तन, जो रणनीति पर असामान्य व्यवहार के प्रभाव को कम करता है।
-
विभिन्न समय अवधि के लिए पैरामीटर सेटिंग्स और परिणामों का परीक्षण करने के लिए, सबसे अच्छा चक्र और पैरामीटर संयोजन खोजने के लिए।
संक्षेप
इस रणनीति में ट्रेंड विश्लेषण और अस्थिरता की निगरानी के फायदे शामिल हैं, जो टीएफओ और एटीआर के सूचक संयोजन के माध्यम से बाजार की दिशा का निर्धारण करते हैं; अतिरिक्त स्थिति खोलने, आंशिक स्थिति को बंद करने, जोखिम को नियंत्रित करने और जोखिम को नियंत्रित करने के लिए अतिरिक्त तंत्र स्थापित किए गए हैं, जो बहु-प्रभावी स्थितियों के लिए उपयुक्त हैं; और विस्तार योग्य अनुकूलन स्थान है, जिसमें अधिक संकेतक फ़िल्टर और पैरामीटर अनुकूलन को जोड़कर रणनीति के प्रदर्शन में और सुधार किया जा सकता है। मूल रूप से एक मात्रात्मक रणनीति की बुनियादी कार्यक्षमता आवश्यकताओं को पूरा करना, गहराई से अध्ययन और आवेदन के लायक है।
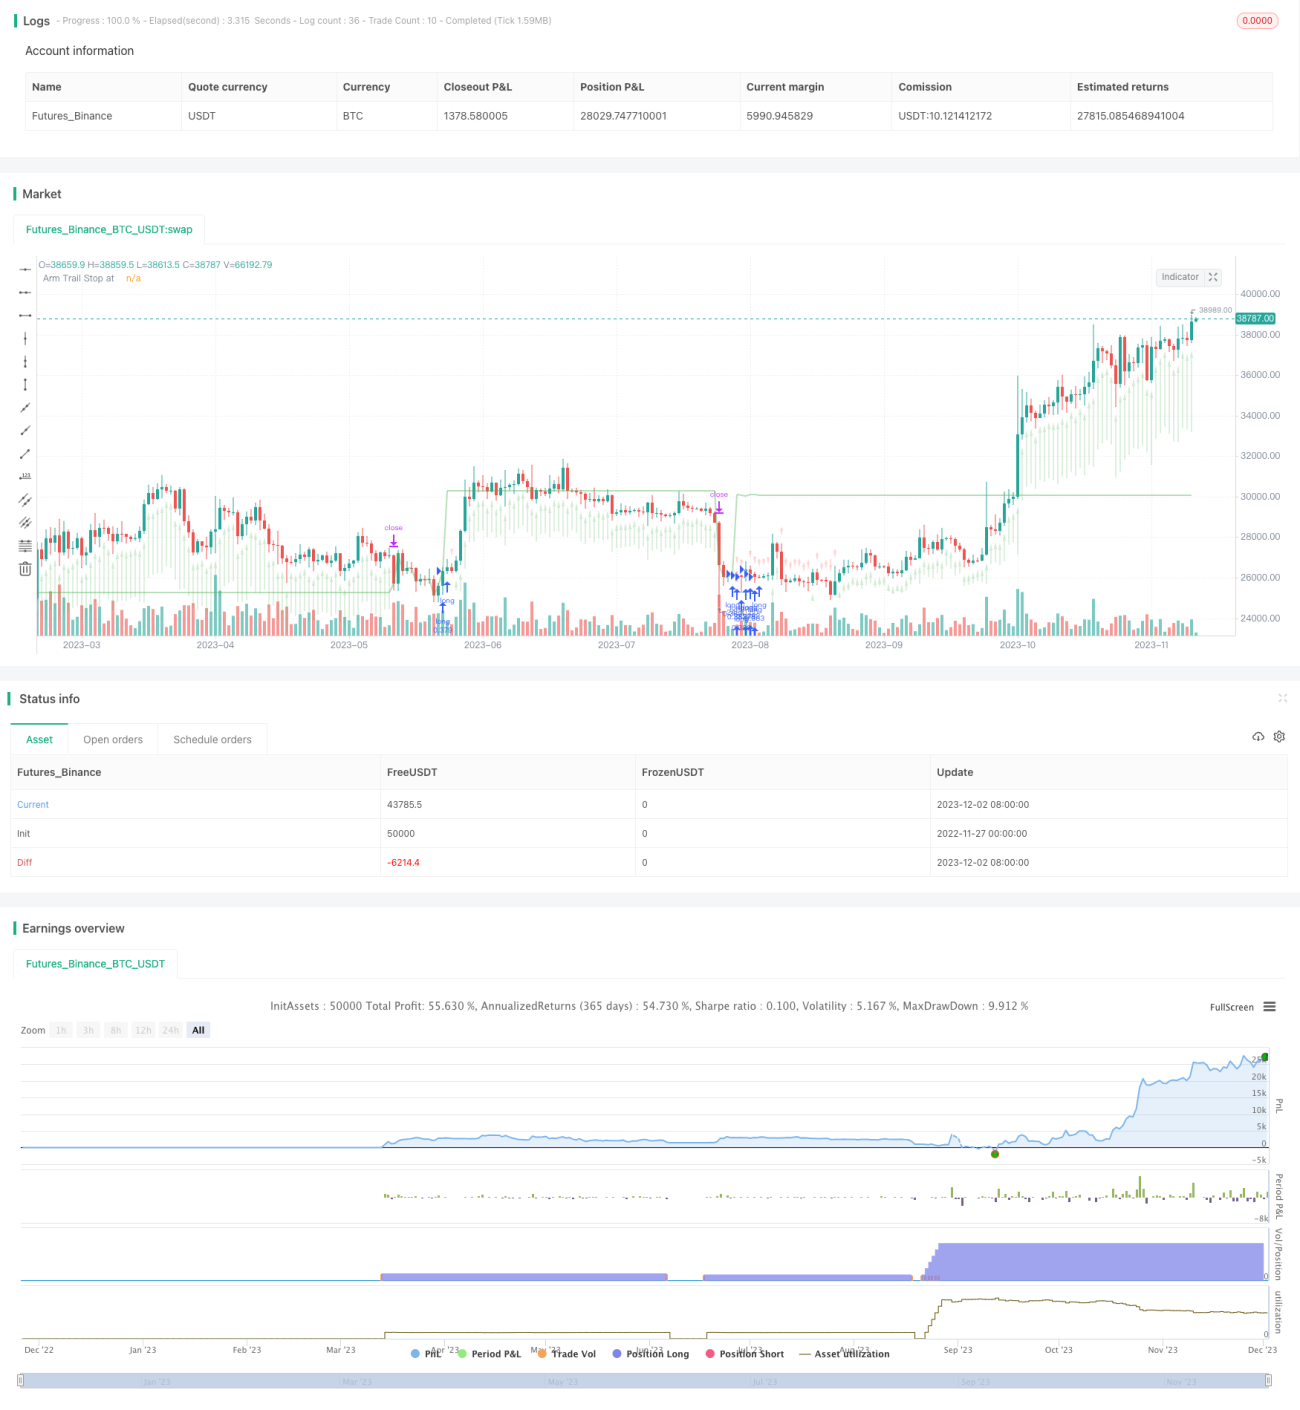
/*backtest
start: 2022-11-27 00:00:00
end: 2023-12-03 00:00:00
period: 1d
basePeriod: 1h
exchanges: [{"eid":"Futures_Binance","currency":"BTC_USDT"}]
*/

// This source code is subject to the terms of the Mozilla Public License 2.0 at https://mozilla.org/MPL/2.0/
// © Chart0bserver
//
// Open Source attributions:- 1