मोमेंटम पोजिशनल नोरोबैंड्स रणनीति

1
Follow
1788
Followers
अवलोकन
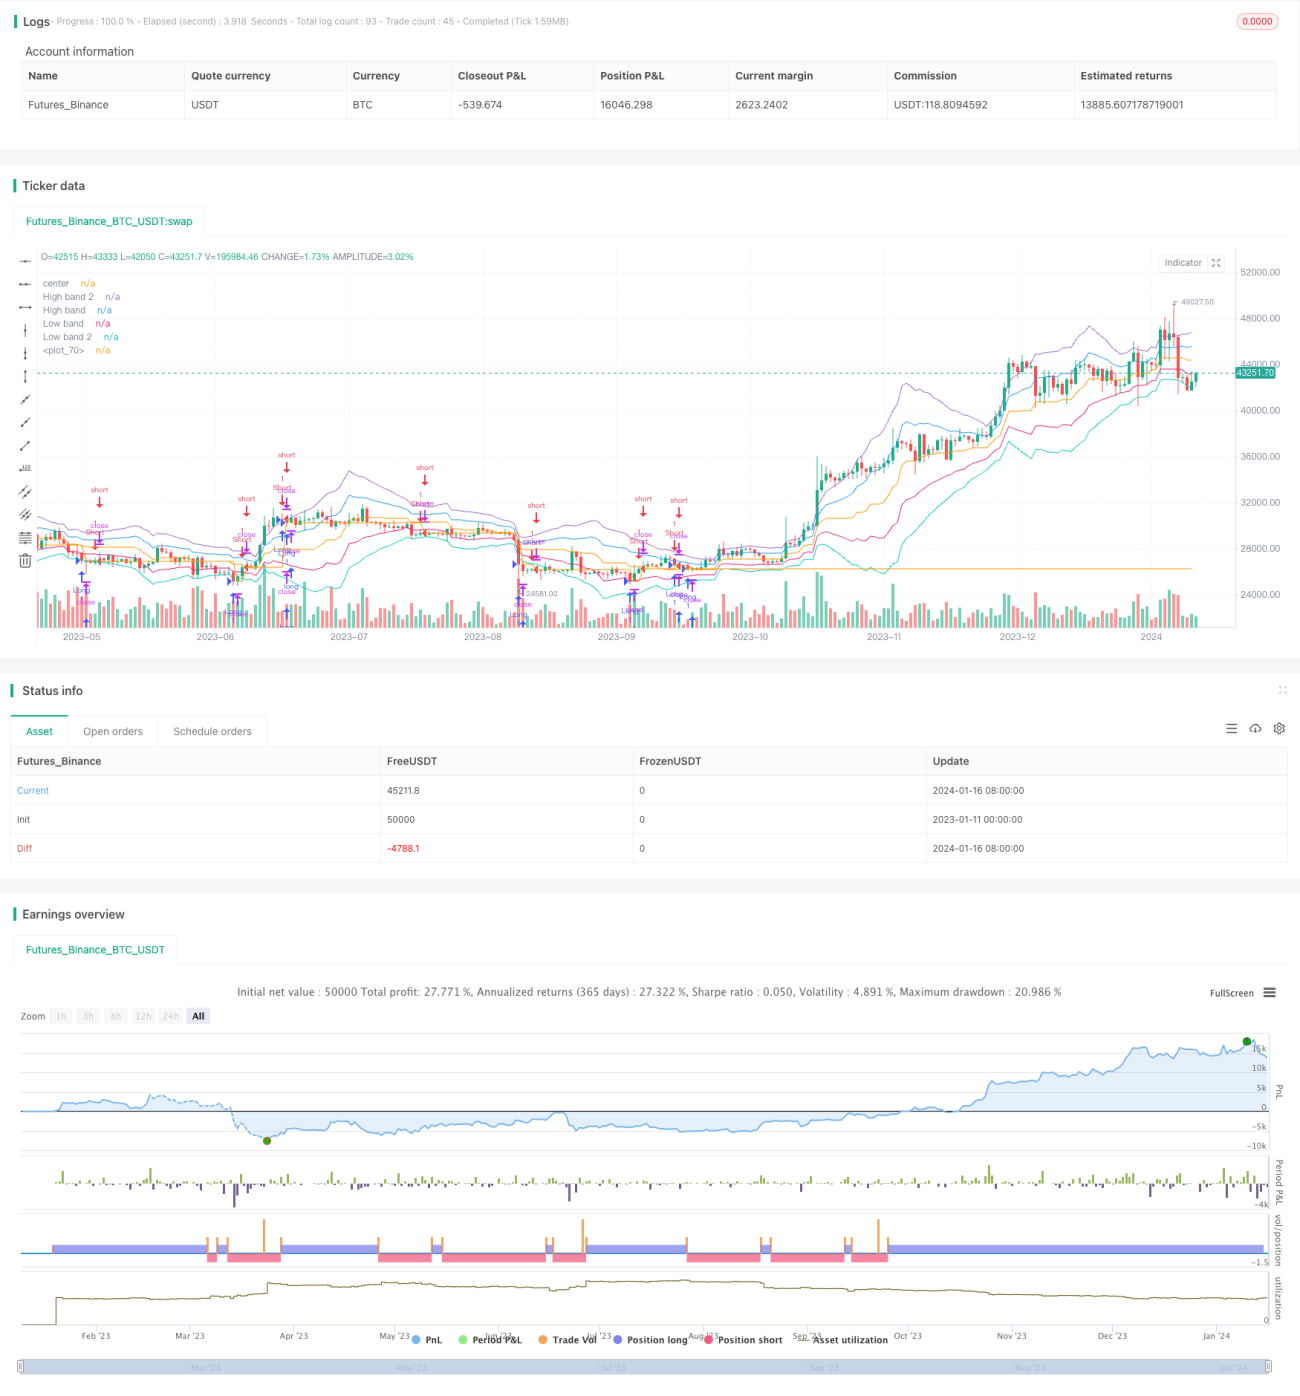
यह रणनीति नोरो के बैंड सिद्धांत पर आधारित एक गतिशील ब्रेकआउट रणनीति है, जो क्वांटिटेटिव तकनीक के साथ संयुक्त है। यह कई संकेतकों जैसे कि औसत, आरएसआई, बैंड और बैल रंग की गणना करके एक खरीद और बिक्री संकेत बनाता है और बैंड-ब्रेकिंग ट्रेडिंग को सक्षम करता है।
रणनीति सिद्धांत
- औसत वास्तविक आयाम के माध्यम से एक लहर के ऊपरी और निचले ट्रैक की गणना करें। कीमतों के ऊपरी ट्रैक को तोड़ने के लिए एक bullish संकेत है, और निचले ट्रैक को तोड़ने के लिए एक bearish संकेत है।
- आरएसआई सूचकांक के माध्यम से ओवरबॉय ओवरसोल्ड क्षेत्र को देखते हुए, आरएसआई 30 से कम और 70 से अधिक है।
- उच्चतम और निम्नतम मूल्य के ब्रेक के माध्यम से मूल्य की गतिशील दिशा का न्याय करें।
- बैल और भालू के रंग के माध्यम से बहु-मुद्रा और शून्य-मुद्रा बाजारों का न्याय करें। हरा बहु-मुद्रा बाजार, bullish; लाल शून्य-मुद्रा बाजार, bearish।
- ट्रेडिंग सिग्नल के लिए समानांतर फैसले के विचलन के संयोजन में।
श्रेष्ठता विश्लेषण
- कई सूचकांक संयोजन, अधिक सटीकता के लिए
- वेबलैंड सिद्धांत और मात्रात्मक तकनीक के संयोजन ने रणनीति को और अधिक प्रभावी बना दिया है।
- गतिशीलता में वृद्धि के साथ-साथ रिवर्स ट्रेडिंग से लाभ की संभावना बढ़ जाती है।
- स्केलेबल, बाजार के अनुसार पैरामीटर को समायोजित करने योग्य।
जोखिम विश्लेषण
- पैरामीटर सेटिंग्स को लगातार अनुकूलित और परीक्षण करने की आवश्यकता होती है।
- एक बार जब आप एक बहु-क्षेत्र स्विच करते हैं, तो आप समय पर प्रतिक्रिया नहीं दे सकते हैं, जिससे नुकसान हो सकता है।
- ट्रेडिंग शुल्क और स्लिप पॉइंट से प्रभावित होने के कारण ट्रेडों की संख्या अधिक होती है।
- समय-समय पर अलग-अलग चक्रों के अनुरूप वेवबैंड मापदंडों को समायोजित करें।
अनुकूलन दिशा
- बहु-समय चक्र सत्यापन, सबसे अच्छा पैरामीटर संयोजन की तलाश में।
- एक और स्टॉपलॉस रणनीति, एकतरफा नुकसान को कम करना।
- वे अपने शेयरों का प्रबंधन करने और उनकी लाभप्रदता में सुधार करने की कोशिश कर रहे हैं।
- डीप लर्निंग के साथ पैरामीटर का स्वचालित अनुकूलन।
संक्षेप
इस रणनीति में कई प्रकार के विशिष्ट मात्रात्मक तकनीकी संकेतकों का समग्र उपयोग किया गया है, जिससे गतिशीलता संकेतकों और रिवर्सिंग संकेतकों के संयोजन के माध्यम से उच्च लाभप्रदता प्राप्त की जा सकती है। साथ ही औसत वास्तविक तरंग दैर्ध्य सिद्धांत का उपयोग उचित प्रवेश बिंदु खोजने के लिए किया जाता है। तकनीकी संकेतकों और सिद्धांतों के संयोजन का एक उदाहरण कहा जा सकता है। पैरामीटर अनुकूलन और जोखिम नियंत्रण के निरंतर सुधार के माध्यम से, यह निश्चित रूप से एक कुशल स्थिरता की मात्रा रणनीति होगी।
Source
Pine
Strategy parameters
Related strategies
Comment
All comments (0)
No data
- 1