मिश्रित ट्रेडिंग रणनीतियाँ
अवलोकन
एस एंड पी 500 मिश्रित मौसमी ट्रेडिंग रणनीति एक मौसमी नियम का उपयोग करके शेयरों के व्यापार के लिए एक मात्रात्मक रणनीति है। यह रणनीति एक मजबूत खरीद-खरीद प्रणाली, तकनीकी संकेतक शर्तों और धन प्रवाह संकेतक को जोड़ती है, जो एक वर्ष में अच्छे और बुरे ट्रेडिंग महीनों के बीच घूमने की अनुमति देती है।
रणनीति सिद्धांत
रणनीति के लिए ट्रेडिंग सिग्नल और नियम मुख्य रूप से निम्नलिखित हैंः
- हर साल अक्टूबर के पहले दिन के कारोबार के दौरान अधिक प्रवेश करें।
- जब VIX 60% से अधिक हो या 15 दिन का एटीआर 90% से अधिक हो, तो मौसमी ट्रेडिंग को निलंबित करें और बाजार में उतार-चढ़ाव के शांत होने तक प्रतीक्षा करें।
- हर साल अगस्त के पहले कारोबार के दिन बंद होते ही शेयरों की स्थिति ठीक हो जाती है।
- जब वीआईएक्स 120% से अधिक हो जाता है या जब कैशफ्लो इंडिकेटर वीएफआई -20 से नीचे जाता है और 10 दिन की औसत नीचे जाती है, तो एक ब्लीडिंग सिग्नल भी जारी किया जाता है।
- वैकल्पिक रूप से शामिल होने के लिए
इस रणनीति में शेयर बाजारों में एक वर्ष के दौरान असमान प्रदर्शन के नियम का उपयोग किया जाता है, जो कि ऐतिहासिक रूप से बेहतर प्रदर्शन करने वाले 10-4 महीनों में अधिक होता है, जो कि ऐतिहासिक रूप से खराब प्रदर्शन करने वाले 5-9 महीनों में स्टॉप या डाउन होता है, और रिवर्स ट्रेडिंग करता है। साथ ही, रणनीति में कुछ तकनीकी संकेतक शर्तें जोड़ी जाती हैं, जो बाजार में भारी उतार-चढ़ाव के दौरान व्यापार को रोकती हैं, जो जोखिम से बचने में मदद करती हैं।
श्रेष्ठता विश्लेषण
S&P500 मिश्रित मौसमी ट्रेडिंग रणनीतियों के निम्नलिखित फायदे हैंः
- परिपक्व और स्थिर मौसमी नियम का उपयोग करना। यह रणनीति एस एंड पी 500 सूचकांक में एक वर्ष के दौरान स्पष्ट रूप से अलग-अलग प्रदर्शन करने वाले महीनों के तथ्य पर आधारित है।
- कई फ़िल्टरिंग शर्तों के साथ मिलकर. रणनीति में VIX, ATR, VFI और कई अन्य शर्तों को जोड़ा गया है, जो Noise को प्रभावी रूप से फ़िल्टर कर सकता है और अधिक विश्वसनीय ट्रेडिंग सिग्नल भेज सकता है.
- विन्यास ट्रेडिंग नियम. रणनीतियों को चुनने के लिए जोड़ा जा सकता है या कम किया जा सकता है, और ट्रेडिंग महीने को आवश्यकता के अनुसार समायोजित किया जा सकता है, परीक्षण और अनुकूलन के लिए आसान है.
- अंतर्निहित जोखिम से बचने के लिए तंत्र. जैसे कि VIX और ATR के उतार-चढ़ाव का पता लगाने के लिए, बाजार में तीव्र उतार-चढ़ाव के प्रभाव से बचने के लिए।
- पूंजी प्रवाह सूचकांक सहायक निर्णय. वीएफआई बाजार के प्रतिभागियों के धन प्रवाह को दर्शाता है, जो रणनीतिक निर्णयों के लिए अतिरिक्त आधार प्रदान करता है।
जोखिम विश्लेषण
S&P500 मिश्रित मौसमी ट्रेडिंग रणनीतियों में भी कुछ संभावित जोखिम हैंः
- ऐतिहासिक नियमों के विफल होने का जोखिम शेयर बाजारों के संचालन में अत्यधिक अनिश्चितता है, इसलिए ऐतिहासिक नियम हमेशा के लिए प्रभावी नहीं हो सकते
- तकनीकी संकेतक में गलत संकेतों का खतरा। VIX, ATR और VFI जैसे संकेतक भी गलत हो सकते हैं।
- पैरामीटर अनुकूलन अपूर्णता का जोखिम. रणनीति पैरामीटर आगे परीक्षण और अनुकूलन किया जा सकता है, मौजूदा पैरामीटर शायद इष्टतम नहीं है.
- वैकल्पिक व्यापार के साथ असीमित हानि का जोखिम है।
जोखिम प्रबंधन, सूचकांक संयोजन, पैरामीटर समायोजन और मशीन सीखने की शुरुआत के माध्यम से उपरोक्त जोखिमों को दूर करने के लिए रणनीति को और मजबूत किया जा सकता है।
अनुकूलन दिशा
S&P500 मिश्रित मौसमी ट्रेडिंग रणनीतियों को और अधिक अनुकूलित किया जा सकता हैः
- परीक्षण के लिए लंबे समय तक इतिहास डेटा प्रशिक्षण. अधिक इतिहास डेटा के साथ फिर से परीक्षण और रणनीति पैरामीटर अनुकूलन कर सकते हैं.
- बढ़ी हुई हानि तंत्र. एकतरफा हानि को प्रभावी ढंग से नियंत्रित करने के लिए अस्थायी या समयबद्ध हानि की स्थापना की जा सकती है।
- अनुकूलित तकनीकी संकेतक पैरामीटर. आप VIX, ATR और VFI के पैरामीटर को अनुकूलित कर सकते हैं ताकि आप सबसे अच्छा संयोजन पा सकें.
- मशीन लर्निंग मॉडल का परिचय दें। पैरामीटर अनुकूलन के लिए न्यूरल नेटवर्क या निर्णय पेड़ का उपयोग करें।
- रणनीतिक संयोजन: अन्य रणनीतियों के साथ संयोजन का परीक्षण किया जा सकता है, जो बाजार के प्रणालीगत जोखिम को कम करने के लिए असंगति का उपयोग करता है।
संक्षेप
एस एंड पी 500 मिश्रित मौसमी ट्रेडिंग रणनीति व्यापक रूप से अनुभवी मौसमी नियम, तकनीकी संकेतक स्थितियों और धन प्रवाह संकेतक का उपयोग करती है। यह रणनीति शेयर बाजार के सबसे खराब प्रदर्शन के महीनों से बचती है, वर्ष के अच्छे ट्रेडिंग महीनों में तैनात की जाती है, और एक प्रभावी बाजार में उतार-चढ़ाव फ़िल्टरिंग तंत्र का निर्माण किया जाता है, जिससे स्थिर अतिरिक्त लाभ प्राप्त होता है। साथ ही, रणनीति का परीक्षण, अनुकूलन और समायोजन करना आसान है, और यह भी एक संदर्भ और दोहराने वाले विकास के लिए एक फ्रेमवर्क प्रदान करता है। अधिक डेटा, स्टॉप लॉस, पैरामीटर समायोजन और संयोजन विधियों को पेश करके रणनीति की प्रभावशीलता को और मजबूत करने की उम्मीद है।
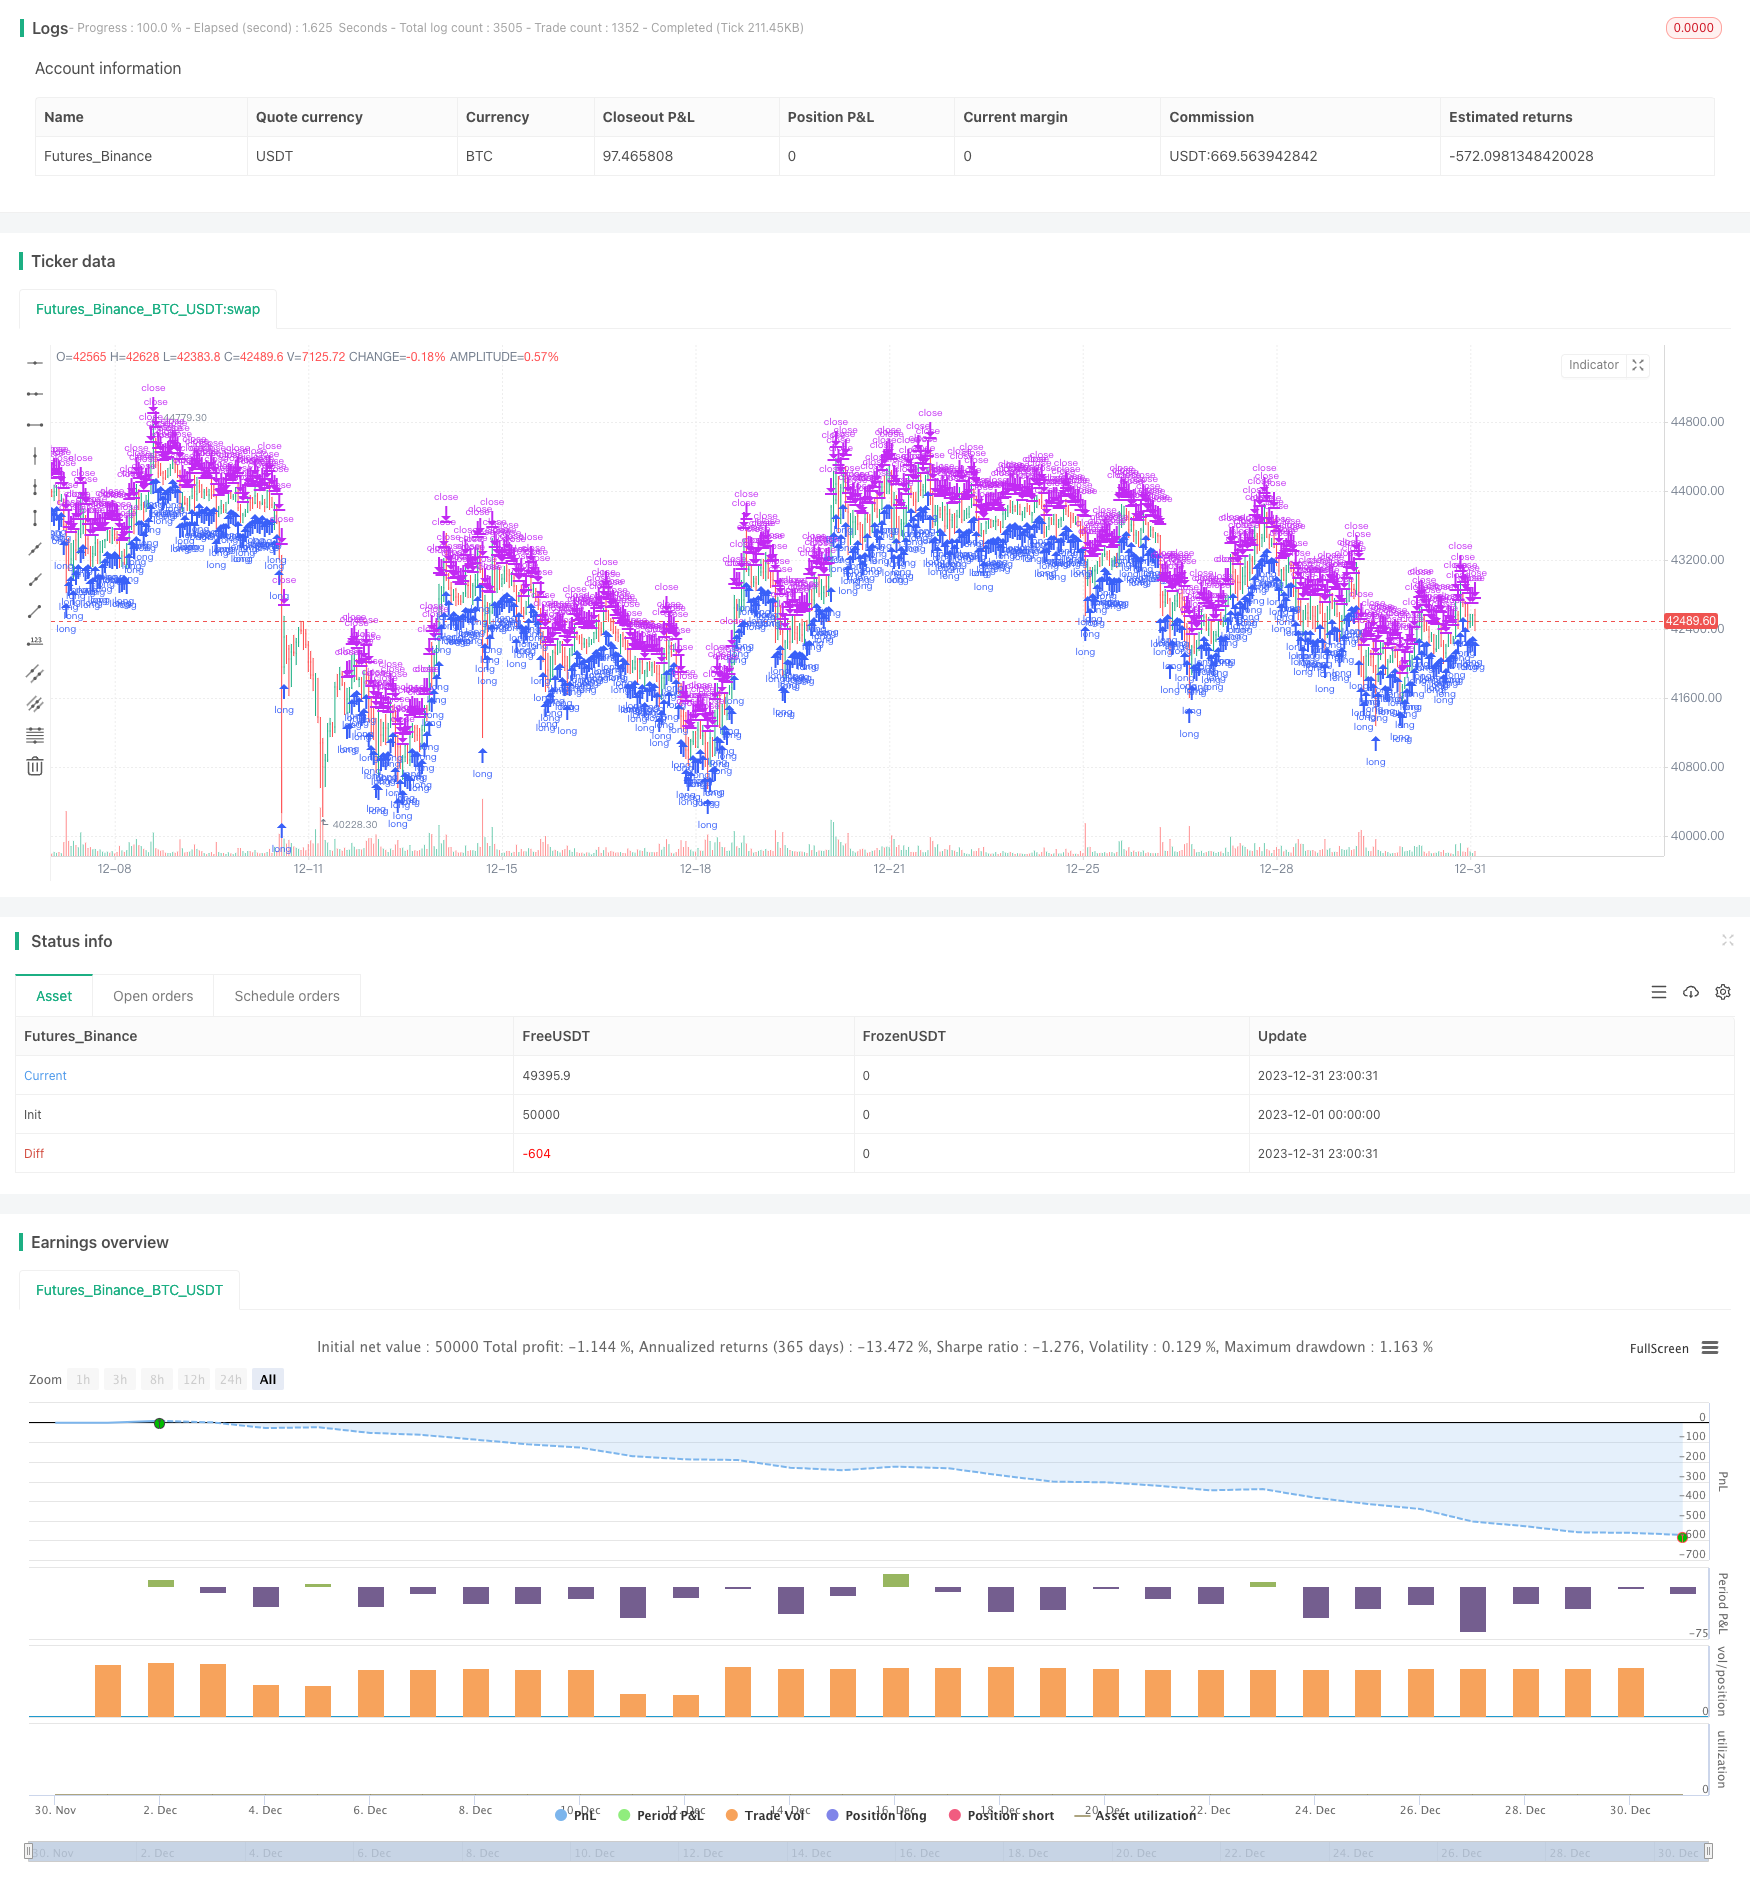
/*backtest
start: 2023-12-01 00:00:00
end: 2023-12-31 23:59:59
period: 1h
basePeriod: 15m
exchanges: [{"eid":"Futures_Binance","currency":"BTC_USDT"}]
*/
// TASC Issue: April 2022 - Vol. 40, Issue 4
// Article: Sell In May? Stock Market Seasonality
// Article By: Markos Katsanos
// Language: TradingView's Pine Script v5
// Provided By: PineCoders, for tradingview.com
//@version=5
strategy(title = "TASC 2022.04 S&P500 Hybrid Seasonal System",
shorttitle = "HSS v2.0",
overlay = true,
default_qty_type = strategy.percent_of_equity,
default_qty_value = 10,
initial_capital = 100000,
currency = currency.USD,
commission_type = strategy.commission.percent,
commission_value = 0.01
)
// Helper Functions:
// @function Returns the ratio to max/min of a sample period
// @param src float, data source.
// @param length int, period of the sample.
// @returns [float, float] tuple.
volatility (float src, int length) =>
[(src / ta.highest(src, length)[1] - 1.0) * 100.0,
(src / ta.lowest (src, length)[1] - 1.0) * 100.0]
// @function Volume Flow Indicator.
// @param Period int, period of the data sample.
// @param VCoef float, Volume Volatility Coefficient.
// @param Coef float, Cutoff Coefficient.
// @returns float.
// ref: https://mkatsanos.com/volume-flow-vfi-indicator/
vfi (int Period = 130, float VCoef = 2.5, float Coef = 0.2) =>
lastHLC3 = nz(hlc3[1], hlc3)
MF = hlc3 - lastHLC3
Vinter = ta.stdev(math.log(hlc3) - math.log(lastHLC3), 30)
Vave = ta.sma(volume, Period)[1]
Cutoff = Coef * close * Vinter
VC = math.min(volume, Vave * VCoef)
VCP = MF > Cutoff ? VC :
MF < -Cutoff ? -VC : 0.0
VFI1 = nz(math.sum(VCP, Period) / Vave)
VFI = ta.ema(VFI1, 3)
// inputs:
// optional strategy obserservation window parameters:
string ig_ow = 'Observation Window:'
bool i_Sdate = input( title = 'Start date:',
defval = timestamp('2021-01-01'),
inline = 'Sdate',
group = ig_ow
) < time //
bool i_useSdate = input.bool( title = '',
defval = false,
group = ig_ow,
inline = 'Sdate',
tooltip = 'Optional start date to clamp strategy observation window.'
) //
bool i_Edate = input( title = 'End date:',
defval = timestamp('2022-01-01'),
inline = 'Edate',
group = ig_ow
) > time //
bool i_useEdate = input.bool( title = '',
defval = false,
group = ig_ow,
inline = 'Edate',
tooltip = 'Optional end date to clamp strategy observation window.'
) //
//
string ig_ro = 'Lookback Options:'
int i_lback = input.int( title = 'Lookback Shift:',
defval = 0, minval = 0,
group = ig_ro,
tooltip = 'Optional, inspect previous signal values.'
) //
//
string ig_so = 'Signal Options:'
bool i_onlyL = input.bool( title = 'Long Only:',
defval = true,
group = ig_so,
tooltip = 'If switched off, short entries are initiated by sell signals.'
) //
int i_sMonth = input.int( title = 'Sell Month:',
defval = 8, minval = 1, maxval = 12, step = 1,
group = ig_so,
tooltip = 'The worst performing month, originally clamped between months 5 and 8.'
) //
int i_maxVI = input.int( title = 'Max VIX up:',
defval = 60, minval = 50, maxval = 60, step = 5,
group = ig_so,
tooltip = 'Volatility maximum threshold.'
) //
int i_critVFI = input.int( title = 'Critical VFI Sell:',
defval = -20, minval = -20, maxval = -15, step = 5,
group = ig_so,
tooltip = 'Critical money float (VFI) threshold for sell signal.'
) //
float i_K = input.float( title = 'ATR/VIX Ratio:',
defval = 1.5, minval = 1.3, maxval = 1.7, step = 0.2,
group = ig_so,
tooltip = 'ATR to VIX ratio for sell signal.'
) //
//
string i_VIticker = input( title = 'Volatility Index:',
defval = 'VIX',
group = ig_so,
tooltip = 'Volatility Index Ticker.'
) //
string i_VItf = input.timeframe( title = '',
defval = 'D',
group = ig_so,
tooltip = 'Volatility Index Timeframe.'
) //
int i_VIiperiod = input.int( title = 'Implied Volatility period:',
defval = 25,
group = ig_so
) //
int i_VIhperiod = input.int( title = 'Historical Volatility period:',
defval = 15,
group = ig_so
) //
//
int i_VFIperiod = input.int( title = 'VFI period:',
defval = 130,
group = ig_so, inline = 'VFI1'
) //
int i_VFIMperiod = input.int( title = 'MA:',
defval = 10,
group = ig_so, inline = 'VFI1',
tooltip = 'VFI and Moving Average sampling period.'
) //
float i_VFIcoef = input.float( title = 'VFI Coef Cuttoff:',
defval = 0.2,
group = ig_so, inline = 'VFI2'
) //
float i_VFIvcoef = input.float( title = 'Volat.:',
defval = 2.5,
group = ig_so, inline = 'VFI2',
tooltip = 'VFI Cutoff and Volatility coefficient.'
) //
int i_ATRperiod = input.int( title = 'ATR length:',
defval = 15,
group = ig_so, inline = 'ATR',
tooltip = 'ATR length.'
) //
//
string ig_to = 'Table Options:'
bool i_showT = input.bool( title = 'Show Table:',
defval = false,
group = ig_to,
tooltip = 'Optional toggle.'
) //
string i_Tpos = input.string(title = 'Position:',
defval = position.middle_right,
options = [ position.top_left, position.top_center, position.top_right,
position.middle_left, position.middle_center, position.middle_right,
position.bottom_left, position.bottom_center, position.bottom_right ],
group = ig_to) //
int i_Ttransp = input.int( title = 'Transparency:',
defval = 0, minval = 1, maxval = 99,
group = ig_to
) //
//
color i_Tcframe = input.color( title = 'Table Colors:',
defval = #000000,
group = ig_to, inline = 'table color'
) //
color i_Tcrowe = input.color( title = '',
defval = #d6dae3,
group = ig_to, inline = 'table color'
) //
color i_Tcrowo = input.color( title = '',
defval = #cccccc,
group = ig_to, inline = 'table color',
tooltip = 'Table background colors, in order: frame, even row, odd row.'
) //
string i_Ttsize = input.string(title = 'Table Text:',
defval = size.small,
options = [size.auto, size.huge, size.large, size.normal, size.small, size.tiny],
group = ig_to, inline = 'table text'
) //
color i_Tcdeft = input.color( title = 'Text Colors:',
defval = #000000,
group = ig_to, inline = 'table text'
) //
color i_Tcsigt = input.color( title = '',
defval = color.red,
group = ig_to, inline = 'table text'
) //
color i_Tctitt = input.color( title = '',
defval = color.navy,
group = ig_to, inline = 'table text',
tooltip = 'Table text size and colors, in order: default, short signal, title.'
) //
// Comparison Index
float VIX = request.security(i_VIticker, i_VItf, close)
[VIdn, VIup] = volatility(VIX, i_VIiperiod) // Implied
[ATRdn, ATRup] = volatility(ta.atr(i_VIhperiod), i_VIiperiod) // Historical
float VFI = vfi(i_VFIperiod, i_VFIvcoef, i_VFIcoef)
float VFI10 = ta.sma(VFI, i_VFIMperiod)
//
bool VFIatCrit = VFI > i_critVFI
bool lowVolat = (VIup < i_maxVI) or (ATRup < (i_K * i_maxVI))
bool VolatC = VFIatCrit ? lowVolat : false
bool Long = ((month >= 10) or (month < i_sMonth)) and VolatC[1]
bool Sseasonal = month == i_sMonth // SEASONAL EXIT/SHORT
bool Svol = VIup > (2.0 * i_maxVI) // VOLATILITY EXIT/SHORT
bool Scrit = ta.cross(i_critVFI, VFI) and (VFI10 < VFI10[1]) // VFI EXIT/SHORT
bool Short = Sseasonal or Svol[1] or Scrit[1]
bool withinObsWindow = true
//
if withinObsWindow and strategy.equity > 0
_L = strategy.long
_S = strategy.short
strategy.entry('L' , direction = _L, when = Long )
if i_onlyL
strategy.close('L', comment = 'EXIT SEASONAL' , when = Sseasonal )
strategy.close('L', comment = 'EXIT VOLATILITY', when = Svol[1] )
strategy.close('L', comment = 'EXIT MF' , when = Scrit[1] )
else
strategy.entry('S Seasonal' , direction = _S, when = Sseasonal )
strategy.entry('S Volatility', direction = _S, when = Svol[1] )
strategy.entry('S MF Crit.' , direction = _S, when = Scrit[1] )
else
strategy.close_all()
string SIGNAL = switch
(Long) => 'Long Seasonal'
(Sseasonal and i_onlyL) => 'Exit Seasonal'
(Svol[1] and i_onlyL) => 'Exit Volatility'
(Scrit[1] and i_onlyL) => 'Exit Money Flow'
(Sseasonal and not i_onlyL) => 'Short Seasonal'
(Svol[1] and not i_onlyL) => 'Short Volatility'
(Scrit[1] and not i_onlyL) => 'Short Money Flow Bearish'
=> 'none'
string date = str.format(
'{0,number,0000}-{1,number,00}-{2,number,00}',
year, month, dayofmonth
)
var table dTable = table.new(position = i_Tpos,
columns = 2,
rows = 17,
frame_color = color.new(#000000, i_Ttransp),
frame_width = 4
) //
// @function Helper to populate the table rows.
tRow(tableId, idx, left, right, tcol=0) =>
color _bg = color.new(idx % 2 ? i_Tcrowo : i_Tcrowe, i_Ttransp)
color _tx = switch (tcol)
(1) => color.new(i_Tcsigt, i_Ttransp)
(2) => color.new(i_Tctitt, i_Ttransp)
=> color.new(i_Tcdeft, i_Ttransp)
// table.cell( table_id=tableId,
// column=0, row=idx,
// text=left, text_color=_tx, text_halign=text.align_right, text_size=i_Ttsize,
// bgcolor=_bg) //
// table.cell( table_id=tableId,
// column=1, row=idx,
// text=str.tostring(right), text_color=_tx, text_halign=text.align_left, text_size=i_Ttsize,
// bgcolor=_bg) //
if i_showT
float _atr10 = ta.atr(10)[i_lback]
string _nf = '0.00'
string _aru = '🔼 ', string _ard = '🔽 '
// id | idx | left label | right label | conditional color |
tRow(dTable, 00, 'S&P500 Hybrid Seasonal ' , '' , 2 )
tRow(dTable, 01, 'Created By: Markos Katsanos' , '' , 2 )
tRow(dTable, 02, 'Date:' , date[i_lback] )
tRow(dTable, 03, 'Signal:' , SIGNAL[i_lback] )
tRow(dTable, 04, 'Price:' , open[i_lback] )
tRow(dTable, 05, 'VIX:' , str.tostring( VIX[i_lback], _nf) )
tRow(dTable, 06, 'VFI:' , str.tostring( VFI[i_lback], _nf) , VFIatCrit ? 1 : 0 )
tRow(dTable, 07, 'ATR:' , str.tostring( _atr10, _nf) )
tRow(dTable, 08, 'VIup%:' , str.tostring( VIup[i_lback], _nf) , VIup > i_maxVI ? 1 : 0 )
tRow(dTable, 09, 'ATRup%:' , str.tostring(ATRup[i_lback], _nf) , ATRup > i_K * i_maxVI ? 1 : 0 )
tRow(dTable, 10, 'VIdn%:' , str.tostring( VIdn[i_lback], _nf) )
tRow(dTable, 11, 'ATRdn%:' , str.tostring(ATRdn[i_lback], _nf) )
tRow(dTable, 12, _aru + 'Long Seasonal:' , Long[i_lback] )
tmp = 12
if not i_onlyL
tmp := 13
tRow(dTable, 13, _ard + 'Short:' , Short[i_lback] , Short[i_lback] ? 1 : 0 )
tRow(dTable, tmp+1, _ard + 'Seasonal:' , Sseasonal[i_lback] , Sseasonal[i_lback] ? 1 : 0 )
tRow(dTable, tmp+2, _ard + 'Volatility:' , Svol[1+i_lback] , Svol[1 + i_lback] ? 1 : 0 )
tRow(dTable, tmp+3, _ard + 'Money Flow:' , Scrit[i_lback] , Scrit[i_lback] ? 1 : 0 )