गतिशील अस्थिरता समायोजन प्रवृत्ति अनुसरण रणनीति
अवलोकन
यह अनूठी, नियमित और व्यवस्थित ट्रेडिंग रणनीति ट्रेंड फॉलोइंग की श्रेणी में आती है। यह ट्रेडिंग सिग्नल उत्पन्न करने के लिए कीमतों के एकीकरण के बाद मूल्य अनुक्रम का उपयोग करती है, न कि सीधे स्टॉक की कीमतों का उपयोग करने के लिए। यह रणनीति उन्नत स्थिति समायोजन और जोखिम प्रबंधन तकनीकों का उपयोग करती है, जो आमतौर पर केवल संस्थागत पोर्टफोलियो प्रबंधन में उपयोग की जाती हैं, जैसे कि कमोडिटी ट्रेडिंग सलाहकारों (सीटीए) और फ्यूचर फंडों के प्रबंधन के लिए स्थिति समायोजन का प्रमाण।
रणनीति सिद्धांत
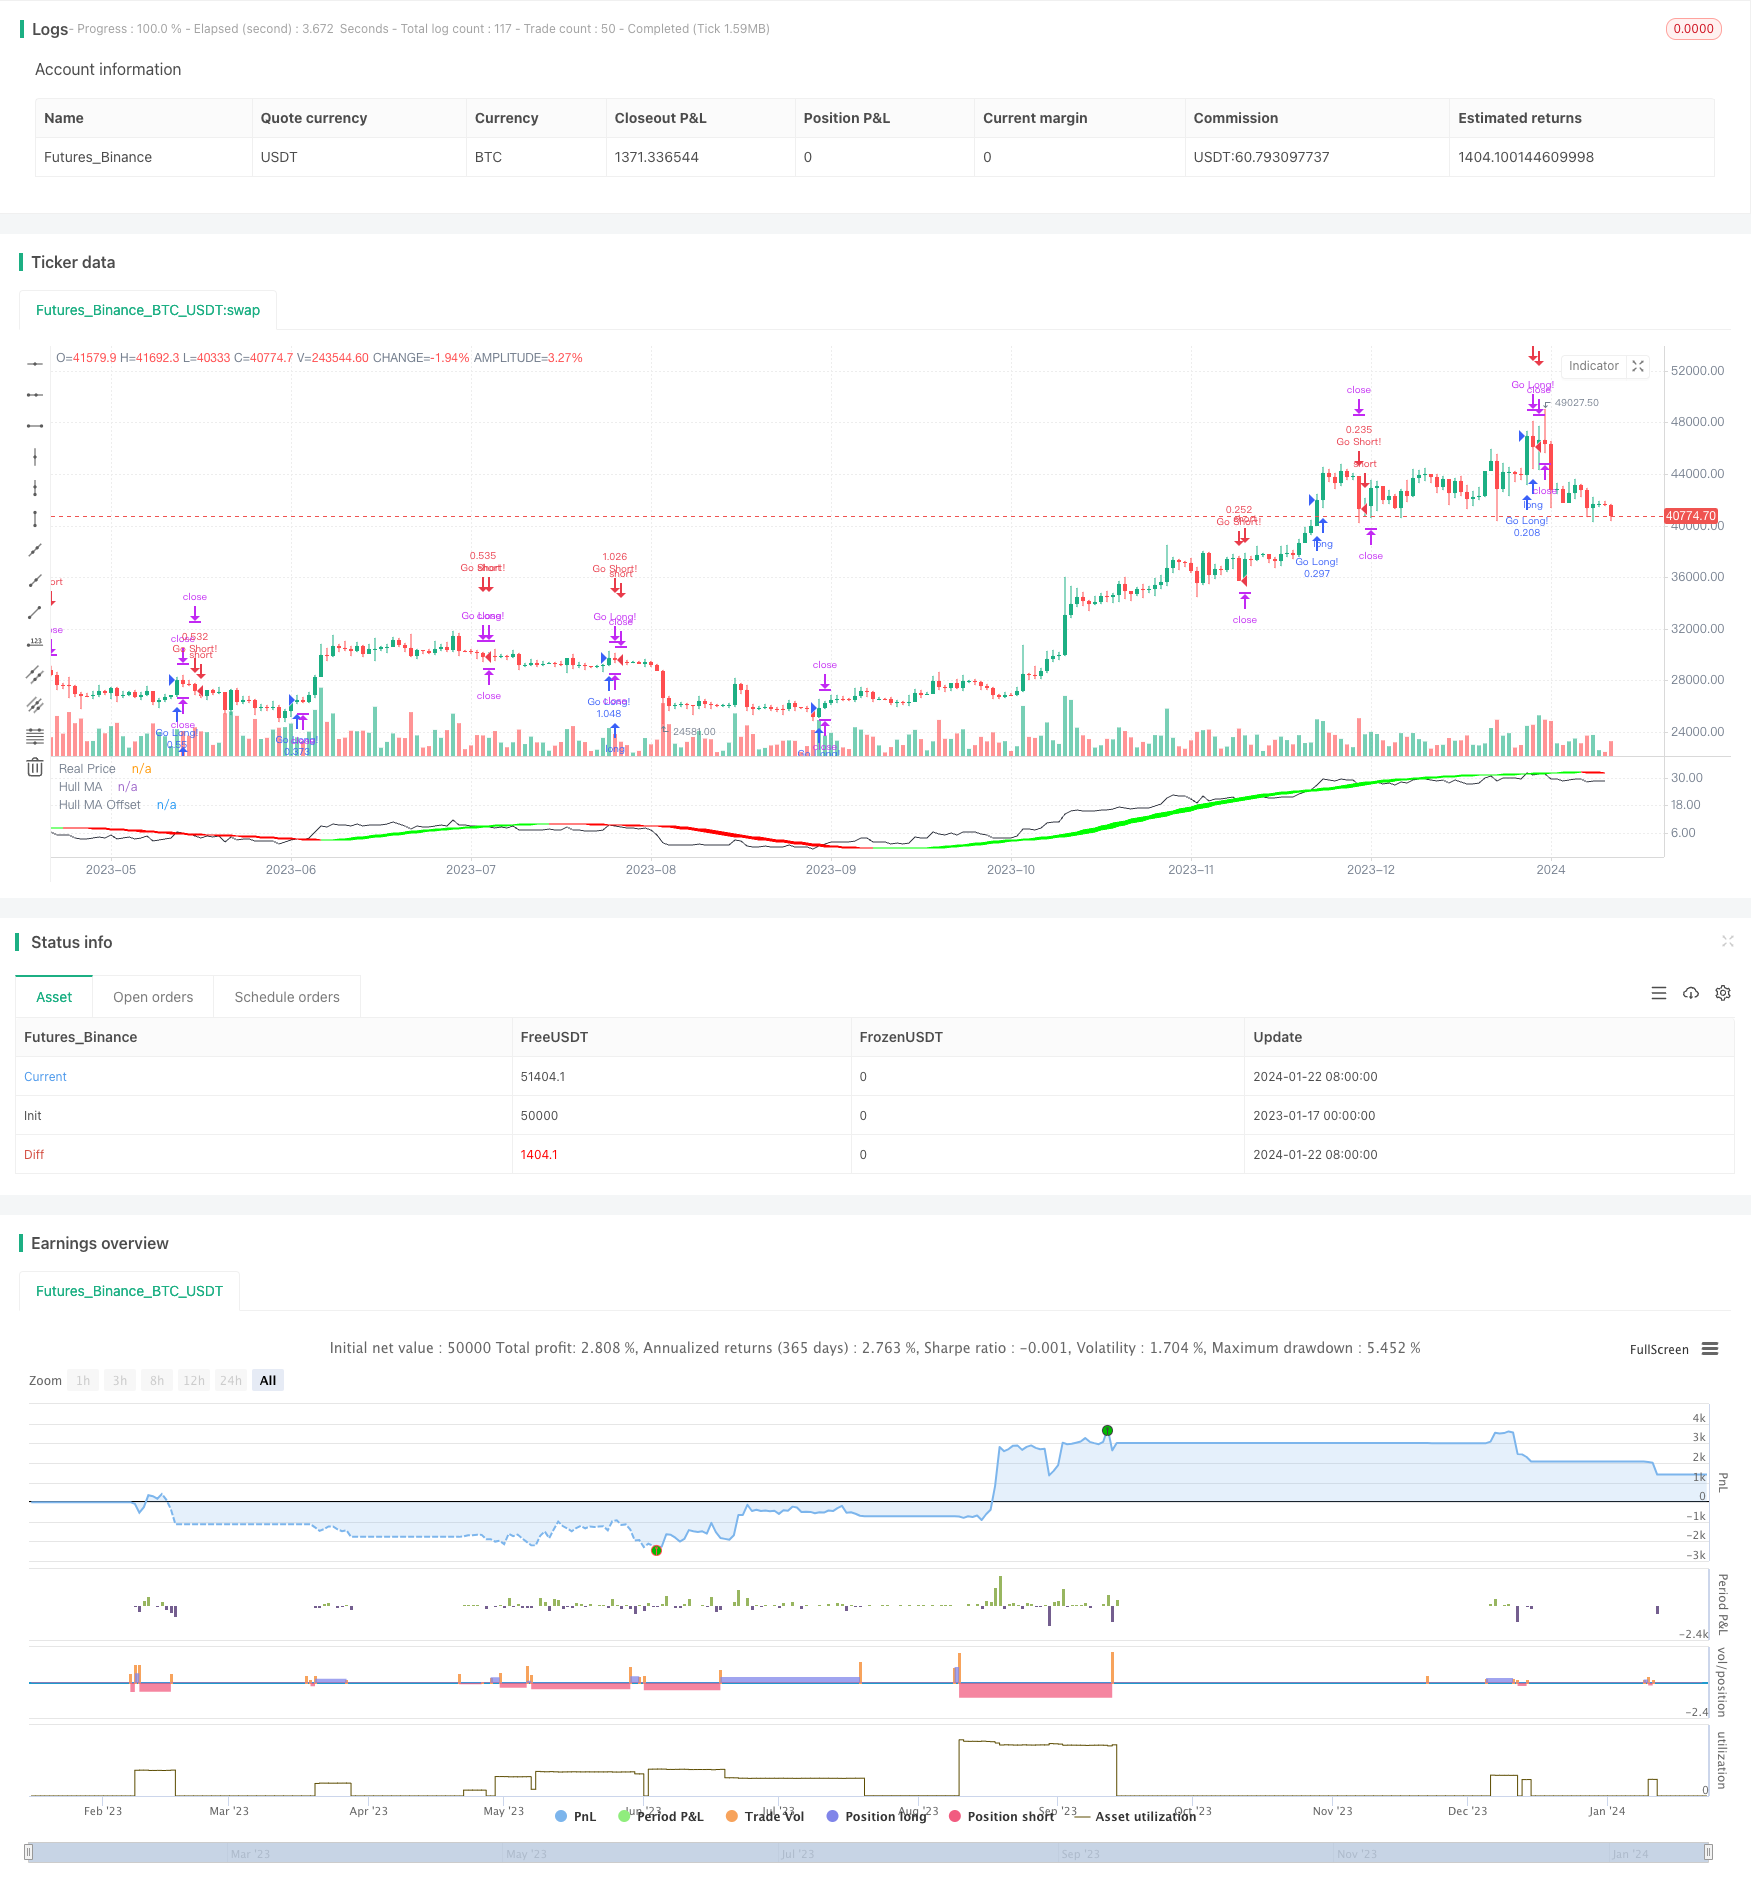
समेकित मूल्य फलक एक अस्थिरता-समायोजित मूल्य-प्रति-दिन आय है जो पूरे मूल्य समय-क्रम के आधार पर गणना की जाती है। अस्थिरता-समायोजन विंडो अवधि उपयोगकर्ता द्वारा परिभाषित की जाती है। हिल की चलती औसत की गणना समेकित मूल्य के आधार पर की जाती है, और मुख्य प्रवृत्ति निर्णय संकेतक के रूप में कार्य करती है। हिल की चलती औसत विंडो अवधि भी उपयोगकर्ता द्वारा परिभाषित की जाती है, 100 दिनों के लिए डिफ़ॉल्ट रूप से, प्रवृत्ति निर्णय की संवेदनशीलता को सुनिश्चित करने के लिए, जबकि बहुत बार व्यापार से बचने के लिए।
ट्रेडिंग रणनीति का मूल बहुत सरल है, एकीकरण मूल्य हिल की चलती औसत को पार करने के लिए ऊपर की ओर अधिक है, नीचे की ओर खाली है। नए ट्रेडिंग सिग्नल सक्रिय रूप से पुराने रिवर्स पोजीशन को खत्म करते हैं।
स्थिति आकार हाल ही में कीमतों में उतार-चढ़ाव और उपयोगकर्ता द्वारा परिभाषित वार्षिक जोखिम लक्ष्य पर आधारित है। वस्तुतः, स्थिति आकार को उतार-चढ़ाव के आधार पर समायोजित किया जाता है, कम उतार-चढ़ाव के साथ अधिक, उच्च उतार-चढ़ाव के साथ कम। हाल ही में 14 दिन की कीमतों के लिए प्रतिद्वंद्वी रिटर्न मानक अंतर के साथ, एक वर्ष की अपेक्षित उतार-चढ़ाव को आगे बढ़ाया जाता है। फिर उपयोगकर्ता द्वारा निर्धारित वार्षिक जोखिम लक्ष्य के अनुसार स्थिति को समायोजित किया जाता है। डिफ़ॉल्ट जोखिम लक्ष्य 10 प्रतिशत के रूप में रूढ़िवादी है।
स्टॉप लॉस को हाल के औसत वास्तविक मूल्य उतार-चढ़ाव के आधार पर गुणांक के रूप में सेट किया जाता है।
रणनीतिक लाभ
- मूल्य एकीकरण का उपयोग करके झूठे संकेतों की संभावना को कम करना
- स्थिति में गतिशील समायोजन, प्रभावी जोखिम नियंत्रण
- वास्तविक समय में रोकना और भी अधिक नुकसान से बचने के लिए
- ट्रेडिंग रणनीति सरल, सहज और समझने में आसान है
रणनीतिक जोखिम
- हिल मूविंग एवरेज के प्रमुख सूचक के रूप में, कुछ अंतराल
- अस्थिरता का उपयोग करके जोखिम को नियंत्रित करने के लिए स्थिति को समायोजित करना, जबकि लाभ के लिए जगह को सीमित करना संभव है
- स्टॉप लॉस के बहुत करीब होने से नुकसान हो सकता है
जोखिम नियंत्रण उपायों में विभिन्न चलती औसत संयोजनों का उपयोग करना, स्थिति जोखिम लक्ष्यों को समायोजित करना आदि शामिल हैं।
रणनीति अनुकूलन
- विभिन्न प्रकार के चलती औसत सूचकांक का परीक्षण करना
- चलती औसत को अनुकूलित करें
- कोशिश करें कि ज्यादा काम करें या कुछ भी न करें
- स्टॉप लॉस को समायोजित करें
- परीक्षण के लिए अन्य नुकसान को रोकने के तरीके
संक्षेप
यह रणनीति कई तकनीकी नियंत्रण जोखिमों को एकीकृत करती है, जैसे कि कीमतों का पुनरुत्थान, गतिशील समायोजन, स्टॉप और अन्य। व्यापार के लिए सरल प्रवृत्ति-अनुसरण सिद्धांतों का उपयोग करें। बाजार और व्यक्तिगत परिस्थितियों के अनुसार पैरामीटर को समायोजित और अनुकूलित किया जा सकता है। यह आगे परीक्षण और सत्यापन के लायक है और व्यावहारिक अनुप्रयोग की क्षमता है।
/*backtest
start: 2023-01-17 00:00:00
end: 2024-01-23 00:00:00
period: 1d
basePeriod: 1h
exchanges: [{"eid":"Futures_Binance","currency":"BTC_USDT"}]
*/

// This source code is subject to the terms of the Mozilla Public License 2.0 at https://mozilla.org/MPL/2.0/
// © Crunchster1

//@version=5
strategy(title="Crunchster's Normalised Trend Strategy", shorttitle="Normalised Trend Strategy", overlay=false )

// Inputs and Parameters
src = input(close, 'Source', group='Strategy Settings')
length = input.int(title="Lookback period for price normalisation filter", defval=14, minval=2, group='Strategy Settings', tooltip='This sets the lookback period for the volatility adjustment of returns, which is used to transform the price series into the "real price"')
hlength = input.int(title="Lookback period for Hull Moving Average", defval=100, minval=2, group='Strategy Settings')
offset = input.int(title="HMA Offset", defval=0, minval=0, group='Strategy Settings')
long = input(true, 'Long', inline='08', group='Strategy Settings')
short = input(true, 'Short', inline='08', group='Strategy Settings', tooltip='Toggle long/short strategy on/off')

stopMultiple = input.float(1, 'Stop multiple', step=0.25, group='Risk Management Settings', tooltip='Multiple for ATR, setting hard stop loss from entry price')
lev = input.float(1, 'Max Leverage', step=0.5, group='Risk Management Settings', tooltip='Max leverage sets maximum allowable leverage of total capital (initial capital + any net profit), capping maximum volatility adjusted position size')
riskT = input.float(10, maxval=75, title='Annualised Volatility Target %', group='Risk Management Settings', tooltip='Specify annual risk target, used to determine volatility adjusted position size. Annualised daily volatility is referenced to this value and position size adjusted accordingly')
comp = input(false, 'Compounding', inline='09', group='Risk Management Settings')
Comppct = input.float(50, '%', step=5, inline='09', group='Risk Management Settings', tooltip='Toggle compounding of profit, and set % of profit to compound')

// Backtesting period
FromDay = input.int(defval=1, title='From Day', minval=1, maxval=31, inline='04', group='Backtest range')
FromMonth = input.int(defval=1, title='From Mon', minval=1, maxval=12, inline='04', group='Backtest range')
FromYear = input.int(defval=2018, title='From Yr', minval=1900, inline='04', group='Backtest range', tooltip='Set start of backtesting period')
ToDay = input.int(defval=1, title='To Day', minval=1, maxval=31, inline='05', group='Backtest range')
ToMonth = input.int(defval=1, title='To Mon', minval=1, maxval=12, inline='05', group='Backtest range')
ToYear = input.int(defval=9999, title='To Yr', minval=1900, inline='05', group='Backtest range', tooltip='Set end of backtesting period')

start = timestamp(FromYear, FromMonth, FromDay, 00, 00)
finish = timestamp(ToYear, ToMonth, ToDay, 23, 59)
window = true

// Normalised returns calculation
nRet = (src - src[1]) / ta.stdev((src - src[1]), length)

nPrice = ta.cum(nRet)

//Hull Moving Average - using normalised price series
fHMA = ta.wma(2 * ta.wma(nPrice[offset], hlength / 2) - ta.wma(nPrice[offset], hlength), math.round(math.sqrt(hlength)))

//Risk Management formulae
strategy.initial_capital = 50000
tr = math.max(high - low, math.abs(high - close), math.abs(low - close)) //True range
stopL = ta.sma(tr, 14) //Average true range
stdev = ta.stdev(close-close[1], 14) //volatility of recent returns
maxcapital = strategy.initial_capital+strategy.netprofit //Maximum capital available to invest - initial capital net of profit
annvol = 100*math.sqrt(365)*stdev/close //converts recent volatility of returns into annualised volatility of returns - assumes daily timeframe

risk = 1.1
if comp
    risk := (strategy.initial_capital+(Comppct*strategy.netprofit/100))//adjust investment capital to include compounding
else
    risk := strategy.initial_capital

shares = (risk * (riskT/annvol)) / close //calculates volatility adjusted position size, dependent on user specified annualised risk target
if ((shares*close) > lev*maxcapital) //ensures position size does not exceed available capital multiplied by user specified maximum leverage
    shares := lev*maxcapital/close

//To set the price at the entry point of trade
Posopen() =>
    math.abs(strategy.position_size[1]) <= 0 and math.abs(strategy.position_size) > 0

var float openN = na
if Posopen()
    openN := stopL

// Strategy Rules
if long
    longCondition = ta.crossover(nPrice, fHMA) and window
    exitlong = ta.crossunder(nPrice, fHMA)
    if (longCondition)
        strategy.entry('Go Long!', strategy.long, qty=shares)
    if strategy.position_size > 0
        strategy.exit('Stop Long', from_entry = 'Go Long!', stop=(strategy.opentrades.entry_price(0) - (openN * stopMultiple)))
    if (exitlong)
        strategy.close('Go Long!', immediately = true)

if short
    shortCondition = ta.crossunder(nPrice, fHMA) and window
    exitshort = ta.crossover(nPrice, fHMA)
    if (shortCondition)
        strategy.entry('Go Short!', strategy.short, qty=shares)
    if strategy.position_size < 0
        strategy.exit('Stop Short', from_entry = 'Go Short!', stop=(strategy.opentrades.entry_price(0) + (openN * stopMultiple)))
    if (exitshort)
        strategy.close('Go Short!', immediately = true)

// Visuals of trend and direction
plot(nPrice, title='Real Price', color=color.black)

MAColor = fHMA > fHMA[3] ? #00ff00 : #ff0000
MA1 = plot(fHMA, title='Hull MA', color=MAColor)
MA2 = plot(fHMA[3], title='Hull MA Offset', color=MAColor)
fill(MA1, MA2, title='Band Filler', color=MAColor)