आरएसआई ट्रेंड फॉलोइंग स्टॉप लॉस रणनीति
अवलोकन
यह एक मात्रात्मक ट्रेडिंग रणनीति है जो RSI का उपयोग करके रुझानों को निर्धारित करती है और स्टॉपलॉस को सेट करती है। यह रणनीति RSI के साथ बाजार की दिशा को निर्धारित करने के साथ-साथ लाभ को लॉक करने के लिए गतिशील स्टॉपलॉस को सेट करने के साथ-साथ जोखिम को अधिकतम करने के लिए होती है।
रणनीति सिद्धांत
यह रणनीति मुख्य रूप से आरएसआई संकेतक के माध्यम से बाजार की प्रवृत्ति की दिशा का निर्णय लेने के लिए अधिक कम करने का निर्णय लेती है। जब आरएसआई संकेतक पर निचली सीमा पार करते हैं, तो यह निर्धारित किया जाता है कि बाजार ऊपर की प्रवृत्ति में है, अधिक करें; जब आरएसआई संकेतक के नीचे उच्च सीमा पार करता है, तो यह निर्धारित किया जाता है कि बाजार गिरावट की प्रवृत्ति में है, कम करें।
साथ ही, रणनीति प्रत्येक आदेश के उद्घाटन मूल्य को ट्रैक करके, एक फ्लोटिंग स्टॉप-लॉस सेट करती है। कई आदेशों के लिए, उद्घाटन मूल्य का एक निश्चित अनुपात एक स्टॉप-लॉस लाइन के रूप में सेट किया जाता है, और एक खुले आदेश के लिए, उद्घाटन मूल्य का एक निश्चित अनुपात एक स्टॉप-लॉस लाइन के रूप में सेट किया जाता है। जब कीमत स्टॉप-लॉस स्टॉप-लॉस लाइन को छूती है, तो रणनीति स्वचालित रूप से स्टॉप-लॉस या स्टॉप-लॉस को बंद कर देती है।
रणनीतिक लाभ
- आरएसआई का उपयोग बाजार के रुझानों की दिशा का आकलन करने के लिए किया जाता है, ताकि ट्रेडों को बंद करने की अवधि से बचा जा सके।
- फ्लोटिंग स्टॉप-लॉस स्टॉप सेट करें, जो लाभ को लचीले ढंग से लॉक करने और जोखिम को प्रभावी ढंग से नियंत्रित करने में सक्षम हो;
- RSI पैरामीटर और स्टॉप-स्टॉप अनुपात को बाहरी इनपुट के माध्यम से समायोजित और अनुकूलित किया जा सकता है।
रणनीतिक जोखिम
- आरएसआई सूचकांक कुछ समय के लिए पीछे रह गया है, और शायद यह अल्पकालिक रुझान परिवर्तन बिंदु से चूक गया है;
- स्टॉपलॉस स्टॉपलाइन के बहुत करीब जाने से स्टॉक खाली हो सकता है।
अनुकूलन दिशा
- आरएसआई सूचकांक के विभिन्न चक्रों के निर्णय की प्रभावशीलता का परीक्षण करना;
- सबसे अच्छा स्टॉप लॉस स्टॉप अनुपात खोजने के लिए विभिन्न पैरामीटर संयोजनों का परीक्षण किया जा सकता है;
- फ़िल्टरिंग सिग्नल के लिए अतिरिक्त संकेतकों को जोड़ा जा सकता है।
संक्षेप
समग्र रूप से, यह रणनीति एक मात्रात्मक ट्रेडिंग रणनीति है जो रुझानों को ट्रैक करने के लिए आरएसआई संकेतकों का उपयोग करती है और फ्लोटिंग स्टॉप लॉस स्टॉप के साथ काम करती है। यह रणनीति जोखिम को नियंत्रित करने के लिए बेहतर काम करती है और लाभ को प्रभावी ढंग से लॉक करने के लिए एक एकल सूचक ट्रेडिंग रणनीति की तुलना में बेहतर है। पैरामीटर अनुकूलन और सहायक सूचक निर्णयों को शामिल करने से रणनीति के प्रदर्शन को और बढ़ाया जा सकता है।
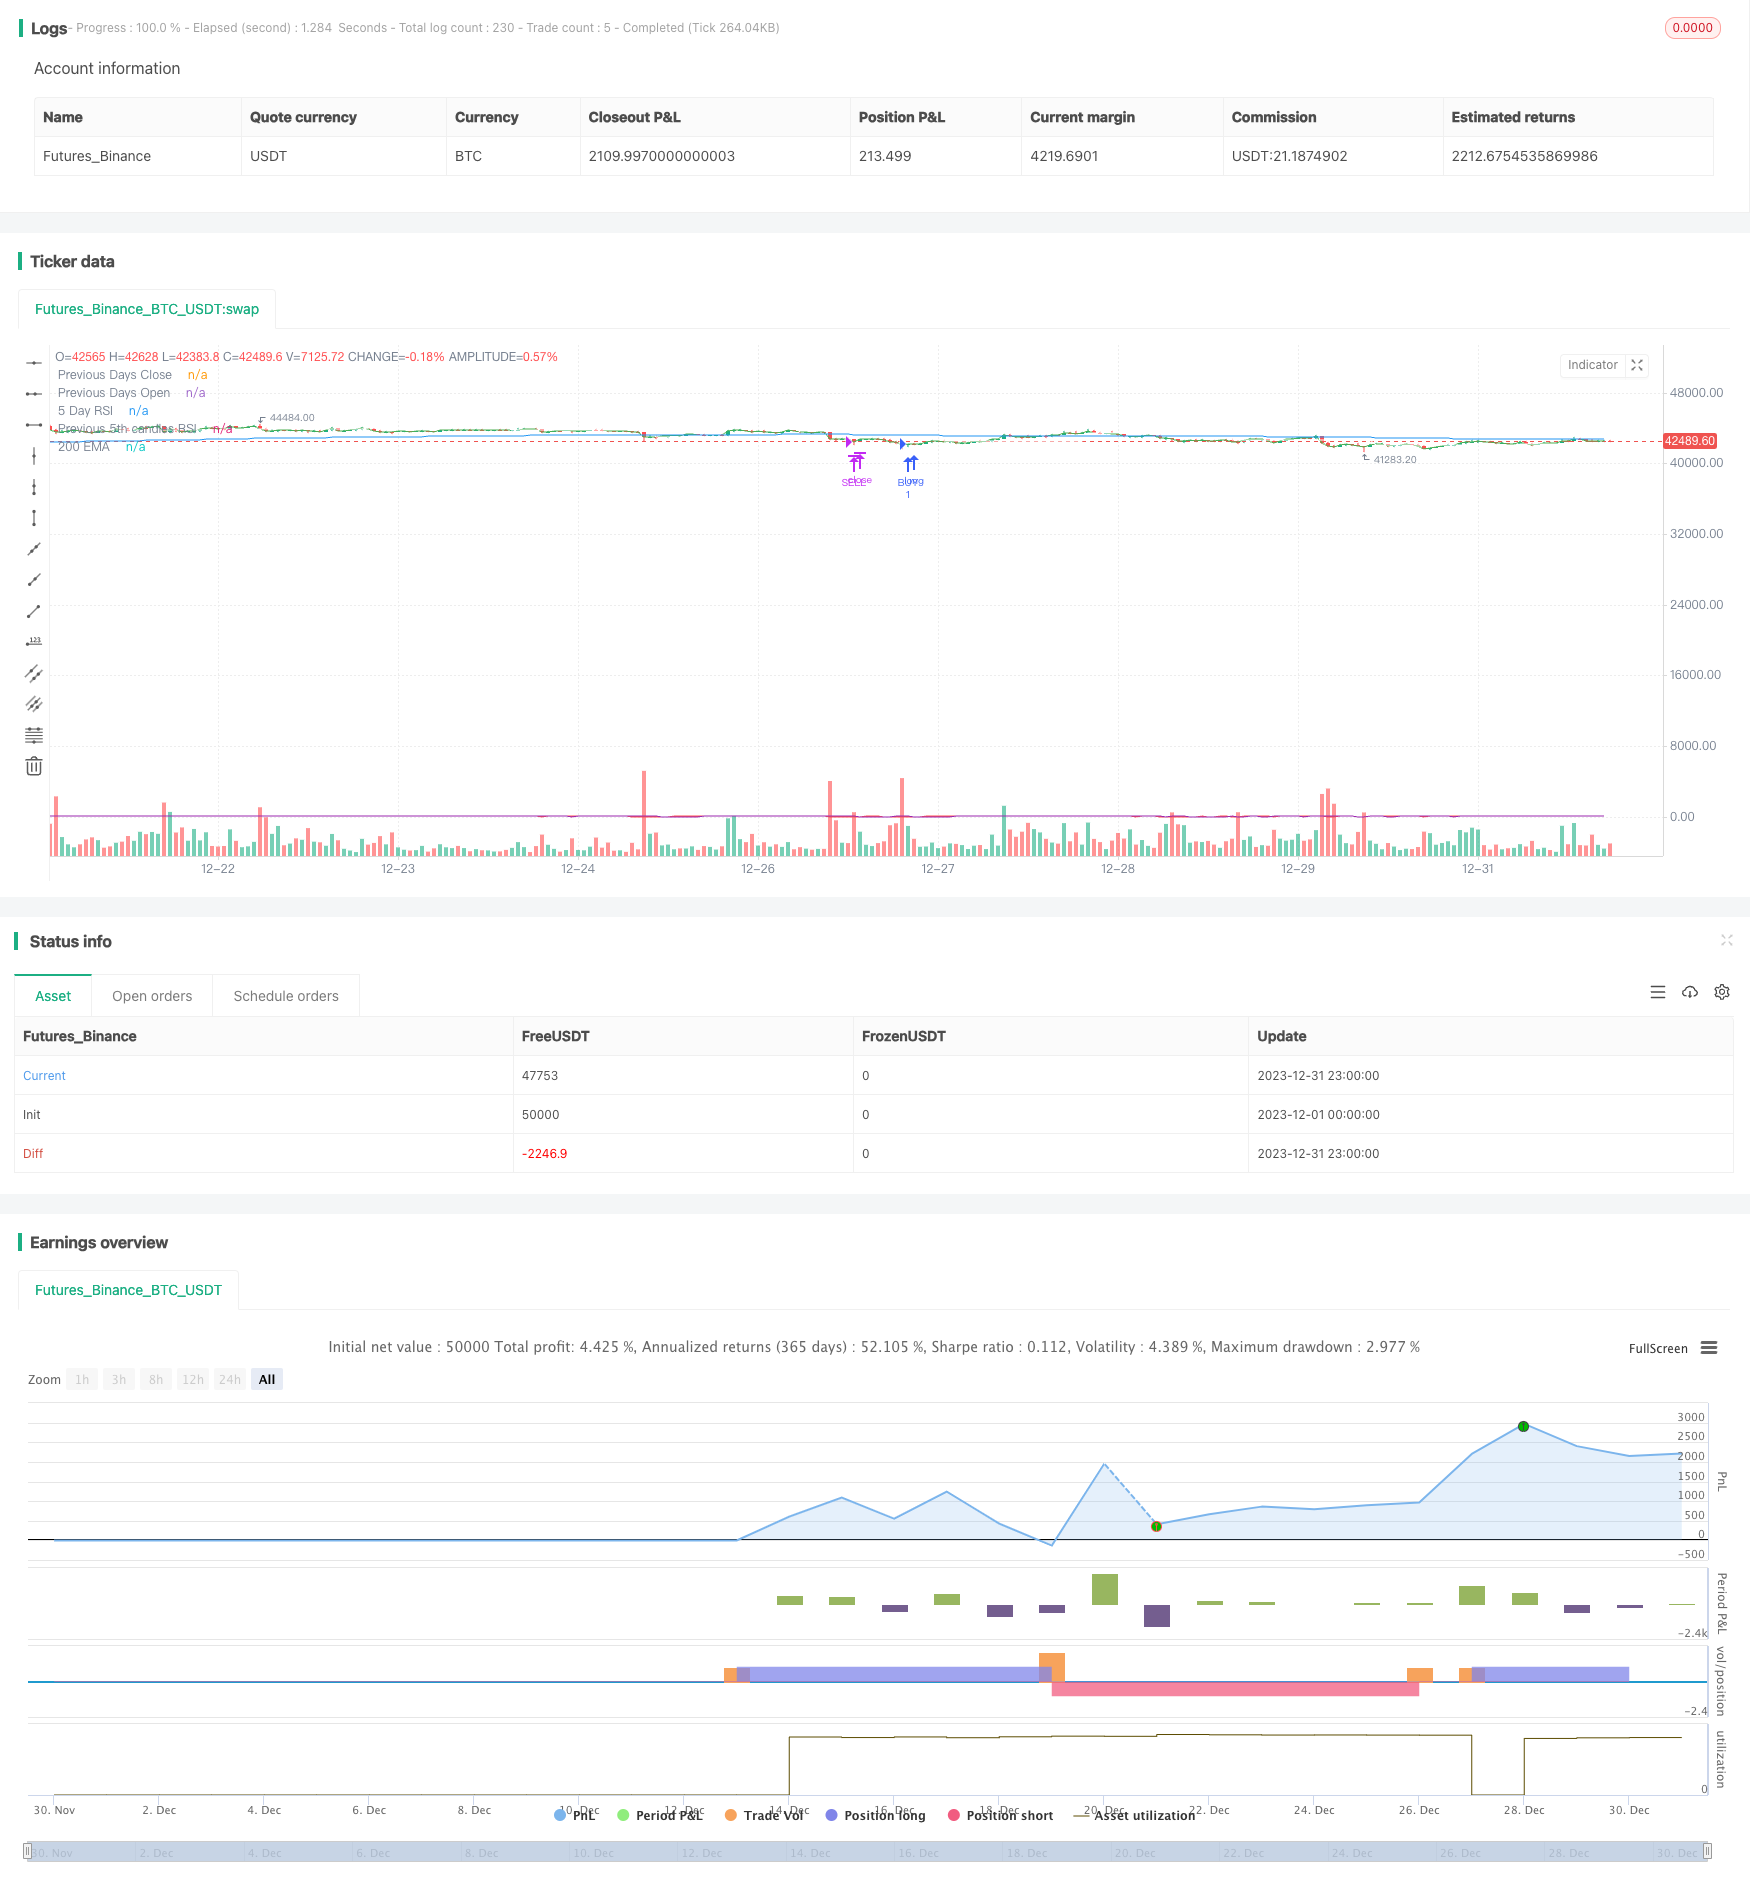
/*backtest
start: 2023-12-01 00:00:00
end: 2023-12-31 23:59:59
period: 1h
basePeriod: 15m
exchanges: [{"eid":"Futures_Binance","currency":"BTC_USDT"}]
*/

// This source code is subject to the terms of the Mozilla Public License 2.0 at https://mozilla.org/MPL/2.0/
// ©chewyScripts.

//@version=5
strategy("96er RSI+200EMA Strategy + Alerts", overlay=true, shorttitle = "The old 96er - RSI5 + 200 EMA")
//,use_bar_magnifier=false
// This works best on a small account $100, with 50% of equity and up to 10 max open trades.
// 96% Profitable, turns $100 into $350 in 1 month. very few losses. super happy with it.
// So far it triples the account on a 1m chart in 1 month back testing on the SEI-USD pair.
// I did not test on FX pairs or other instruments.
// had some issues with the inputs not working so had to hard code some, also the lastClose var sometimes breaks and starts following every candle, not sure why.

in_r1 = input.int(8,"5 day input or RSI1", group = "Signals")
in_lowerRSI = input.int(28,"RSI Lower", group = "Signals")
in_upperRSI = input.int(72,"RSI Upper ", group = "Signals")
in_emaperiod = input.int(200,"EMA Period", group = "Signals")
in_daysback = input.int(1,"Look back days for close/open", group = "Signals")

in_openOrders = input.int(5,"max open orders",tooltip = "Be careful, to high and you will get margin called!! 5 is probably the highest you should go", group = "Order Controls")
in_buybreakout = input.int(40,"Buy breakout range", group = "Order Controls")

in_buyTP = input.float(1.1500,"Buy TP: 1+TP %, .05 seems to work well.", group = "TPSL")
in_sellTP = input.float(0.9750, "Sell TP: 1-TP%. .025 seems to work well. ", group = "TPSL")

in_useAlerts = input.bool(false,"Turns on Buy/Sell Alerts",group = "Alerts")
in_useCustomAlertMSG = input.bool(false,"Use default Buy/Sell or the messages below",group = "Alerts")
in_alertBuySignalTxt = input("Buy","Buy signal API/TXT message template", tooltip = "Review the UserGuid on JSON varibles in alerts", group = "Alerts")
in_alertSellSignalTxt = input("Sell","Sell signal API/TXT message template", tooltip = "Review the UserGuid on JSON varibles in alerts", group = "Alerts")

simple int rsi5 = in_r1

// 3 rsi strategy , when all of them are overbought we sell, and vice versa
rsi7 = ta.rsi(close,rsi5)
[lastOpen, lastClose] = request.security(syminfo.tickerid, "D", [open,close], lookahead = barmerge.lookahead_on)
rsi3 = ta.rsi(close[5],rsi5)

ma = ta.ema(close,in_emaperiod)

plot(rsi7,"5 Day RSI",color.red)
plot(lastClose,"Previous Days Close",color.green)
plot(lastOpen,"Previous Days Open",color.white)
plot(rsi3,"Previous 5th candles RSI",color.purple)
plot(ma,"200 EMA",color.blue)


//sell = ta.crossunder(rsi7,70) and ta.crossunder(rsi14,70) and ta.crossunder(rsi21,70)
//buy = ta.crossover(rsi7,in_lowerRSI) and close < ma and rsi3 <= in_upperRSI and strategy.opentrades < in_openOrders
//sell = ta.crossunder(rsi7,in_upperRSI) and close > ma and rsi3 >= in_lowerRSI3 and strategy.opentrades < in_openOrders

//buy condition
buy = ta.crossover(rsi7,in_lowerRSI) and close < ma and close < lastClose and strategy.opentrades < in_openOrders

// sell condition
sell = ta.crossunder(rsi7,in_upperRSI) and close > ma and close > lastClose and strategy.opentrades < in_openOrders


var lastBuy = close
var lastSell = close
//var buyLabel = label.new(na,na,yloc = yloc.belowbar, style = label.style_none, textcolor = color.green, size = size.normal)
//var sellLabel = label.new(na,na,yloc = yloc.abovebar, style = label.style_none, textcolor = color.red, size = size.normal)
if (buy)
    strategy.entry("BUY", strategy.long,alert_message = "Buy @"+str.tostring(close))
    lastBuy := close
    //buyLabel := label.new(na,na,yloc = yloc.belowbar, style = label.style_none, textcolor = color.green, size = size.normal)
    //label.set_x(buyLabel,bar_index)
    //label.set_y(buyLabel,low)
    //label.set_text(buyLabel,"Buy!!@ " +str.tostring(lastBuy)  + "\n TP: " + str.tostring(lastBuy*in_buyTP) + "\n↑")
    if(not in_useAlerts)
        alert("Buy")

//label.delete(buyLabel)

if ((close >= lastBuy*in_buyTP ) or (rsi7 > in_buybreakout) and close >= lastClose and (close >= lastClose*in_buyTP or close >= lastBuy*in_buyTP ) )
    //label.new(bar_index,na,"TP!!@ " +str.tostring(close), yloc = yloc.abovebar, style = label.style_none, textcolor = color.green, size = size.normal)
    strategy.close("BUY", "BUY Exit",alert_message = "Buy Exit: TP @" +str.tostring(close) + " OR TP: " + str.tostring(lastBuy*in_buyTP))
    if(not in_useAlerts)
        alert("Buy Exit")

if (sell)
    strategy.entry("SELL", strategy.short, alert_message = "Sell @ " + str.tostring(close))
    lastSell := close
    //sellLabel := label.new(na,na,yloc = yloc.abovebar, style = label.style_none, textcolor = color.red, size = size.normal)
    //label.set_x(sellLabel,bar_index)
    //label.set_y(sellLabel,high)
    //label.set_text(sellLabel,"Sell!!@ " +str.tostring(lastSell)  + "\n TP: " + str.tostring(lastSell*in_sellTP) + "\n🠇")
    if(not in_useAlerts)
        alert("Sell")

//label.delete(sellLabel)

if ( close < ma and (close <= lastSell*in_sellTP ) or (close < lastClose*in_sellTP) )
    //label.new(bar_index,na,"TP!!@ " +str.tostring(close), yloc = yloc.belowbar, style = label.style_none, textcolor = color.red, size = size.normal)
    strategy.close("SELL", "Sell Exit", alert_message = "Sell Exit TP @" +str.tostring(close) + " OR TP: " + str.tostring(lastSell*in_sellTP))
    if(not in_useAlerts)
        alert("Sell Exit")


alertcondition(buy and in_useAlerts,"Buy Alert","test")