हेइकिन आशी पर आधारित सुपरट्रेंड ट्रेलिंग स्टॉप लॉस रणनीति
रणनीति अवलोकन
यह रणनीति एक ट्रेंड ट्रैकिंग स्टॉप-लॉस रणनीति है जिसमें हेइकिन आशिकन और सुपरट्रेंड इंडिकेटर शामिल हैं। यह हेइकिन आशिकन ट्रेंड को बाजार के शोर को फ़िल्टर करने, सुपरट्रेंड इंडिकेटर को ट्रेंड की दिशा का आकलन करने और सुपरट्रेंड को गतिशील स्टॉप-लॉस लाइन के रूप में उपयोग करने के लिए एक कुशल ट्रेंड ट्रैकिंग और जोखिम नियंत्रण प्रदान करता है।
रणनीति सिद्धांत
- Heikin Ashi की गणना करने के लिएः मूल्य खोलने, मूल्य बंद करने, उच्चतम मूल्य, न्यूनतम मूल्य।
- सुपरट्रेंड सूचक की गणना करेंः एटीआर और कीमतों के आधार पर अपट्रेल और डाउनट्रेल की गणना करें।
- हेइकिन आशियों और सुपरट्रेंड्स के संयोजन से प्रवृत्ति की दिशा निर्धारित की जाती है।
- जब Heikin Ashi के समापन की कीमत पिछले एक K-लाइन समापन की कीमत के करीब सुपर ट्रेंड की ऊपरी पट्टी के करीब होती है, तो यह एक bullish प्रवृत्ति है; जब Heikin Ashi के समापन की कीमत पिछले एक K-लाइन समापन की कीमत के करीब सुपर ट्रेंड की निचली पट्टी के करीब होती है, तो यह एक bearish प्रवृत्ति है।
- बेंचमार्क रुझान में, सुपर ट्रेंड के ऊपर ट्रैक करने के लिए स्टॉप लाइन का उपयोग करें; बेंचमार्क रुझान में, सुपर ट्रेंड के नीचे ट्रैक करने के लिए स्टॉप लाइन का उपयोग करें।
रणनीतिक लाभ
- Heikin Ashi फ़िल्टर का उपयोग करके, ट्रेंड सिग्नल को पहचानने के लिए एक झूठी दरार का उपयोग किया जाता है।
- सुपरट्रेंड एक गतिशील स्टॉपलॉस के रूप में कार्य करता है, जो ट्रेंड को अधिकतम लाभ के लिए लॉक करता है, जिससे बहुत अधिक वापसी से बचा जाता है।
- विभिन्न समय चक्रों के संयोजन के साथ, उच्च और निम्न स्तर के संकेतों की पुष्टि करने के लिए अधिक विश्वसनीय है।
- समयबद्ध समापन कार्य विशिष्ट समय के तर्कहीन व्यवहार प्रभाव से बचने के लिए।
रणनीतिक जोखिम
- रुझान के उलट होने पर रुकावट का खतरा होता है। रुकावट लाइन को उचित रूप से ढीला करना इस जोखिम को कम करता है।
- सुपरट्रेंड पैरामीटर को गलत तरीके से सेट करने से स्टॉप लॉस बहुत चौड़ा या बहुत संकीर्ण हो सकता है। विभिन्न संयोजनों का परीक्षण किया जा सकता है।
- धन प्रबंधन के मुद्दों पर विचार नहीं किया गया। स्थिति नियंत्रण स्थापित किया जाना चाहिए।
- लेन-देन की लागत को ध्यान में नहीं रखा गया है।
रणनीति अनुकूलन दिशा
- सुपर ट्रेंड पैरामीटर के संयोजन का अनुकूलन करें, सबसे अच्छा पैरामीटर ढूंढें
- स्थिति नियंत्रण जोड़ें
- अतिरिक्त लागत विचार, जैसे कि शुल्क, स्लाइड, आदि।
- रुझान की ताकत और कमजोरी के आधार पर स्टॉप लॉस को लचीले ढंग से समायोजित किया जा सकता है।
- अन्य संकेतकों के साथ प्रवेश संकेतों को फ़िल्टर करने पर विचार करें।
संक्षेप
रणनीति में हेइकिन अस्ची और सुपरट्रेंड्स के दो संकेतकों के फायदे शामिल हैं, जो प्रवृत्ति की दिशा को पकड़ने में सक्षम हैं, जबकि सुपरट्रेंड्स का उपयोग करके स्वचालित गतिशील ट्रैकिंग स्टॉपलॉस का उपयोग करते हैं, जिससे प्रवृत्ति के मुनाफे को लॉक किया जा सकता है। रणनीति का जोखिम मुख्य रूप से प्रवृत्ति प्रतिगमन और पैरामीटर अनुकूलन से आता है, दोनों को आगे के अनुकूलन द्वारा सुधार किया जा सकता है। कुल मिलाकर, रणनीति ने संकेतकों के एकीकरण का उपयोग करके ट्रेडिंग सिस्टम की स्थिरता और लाभप्रदता को बढ़ाया है।
/*backtest
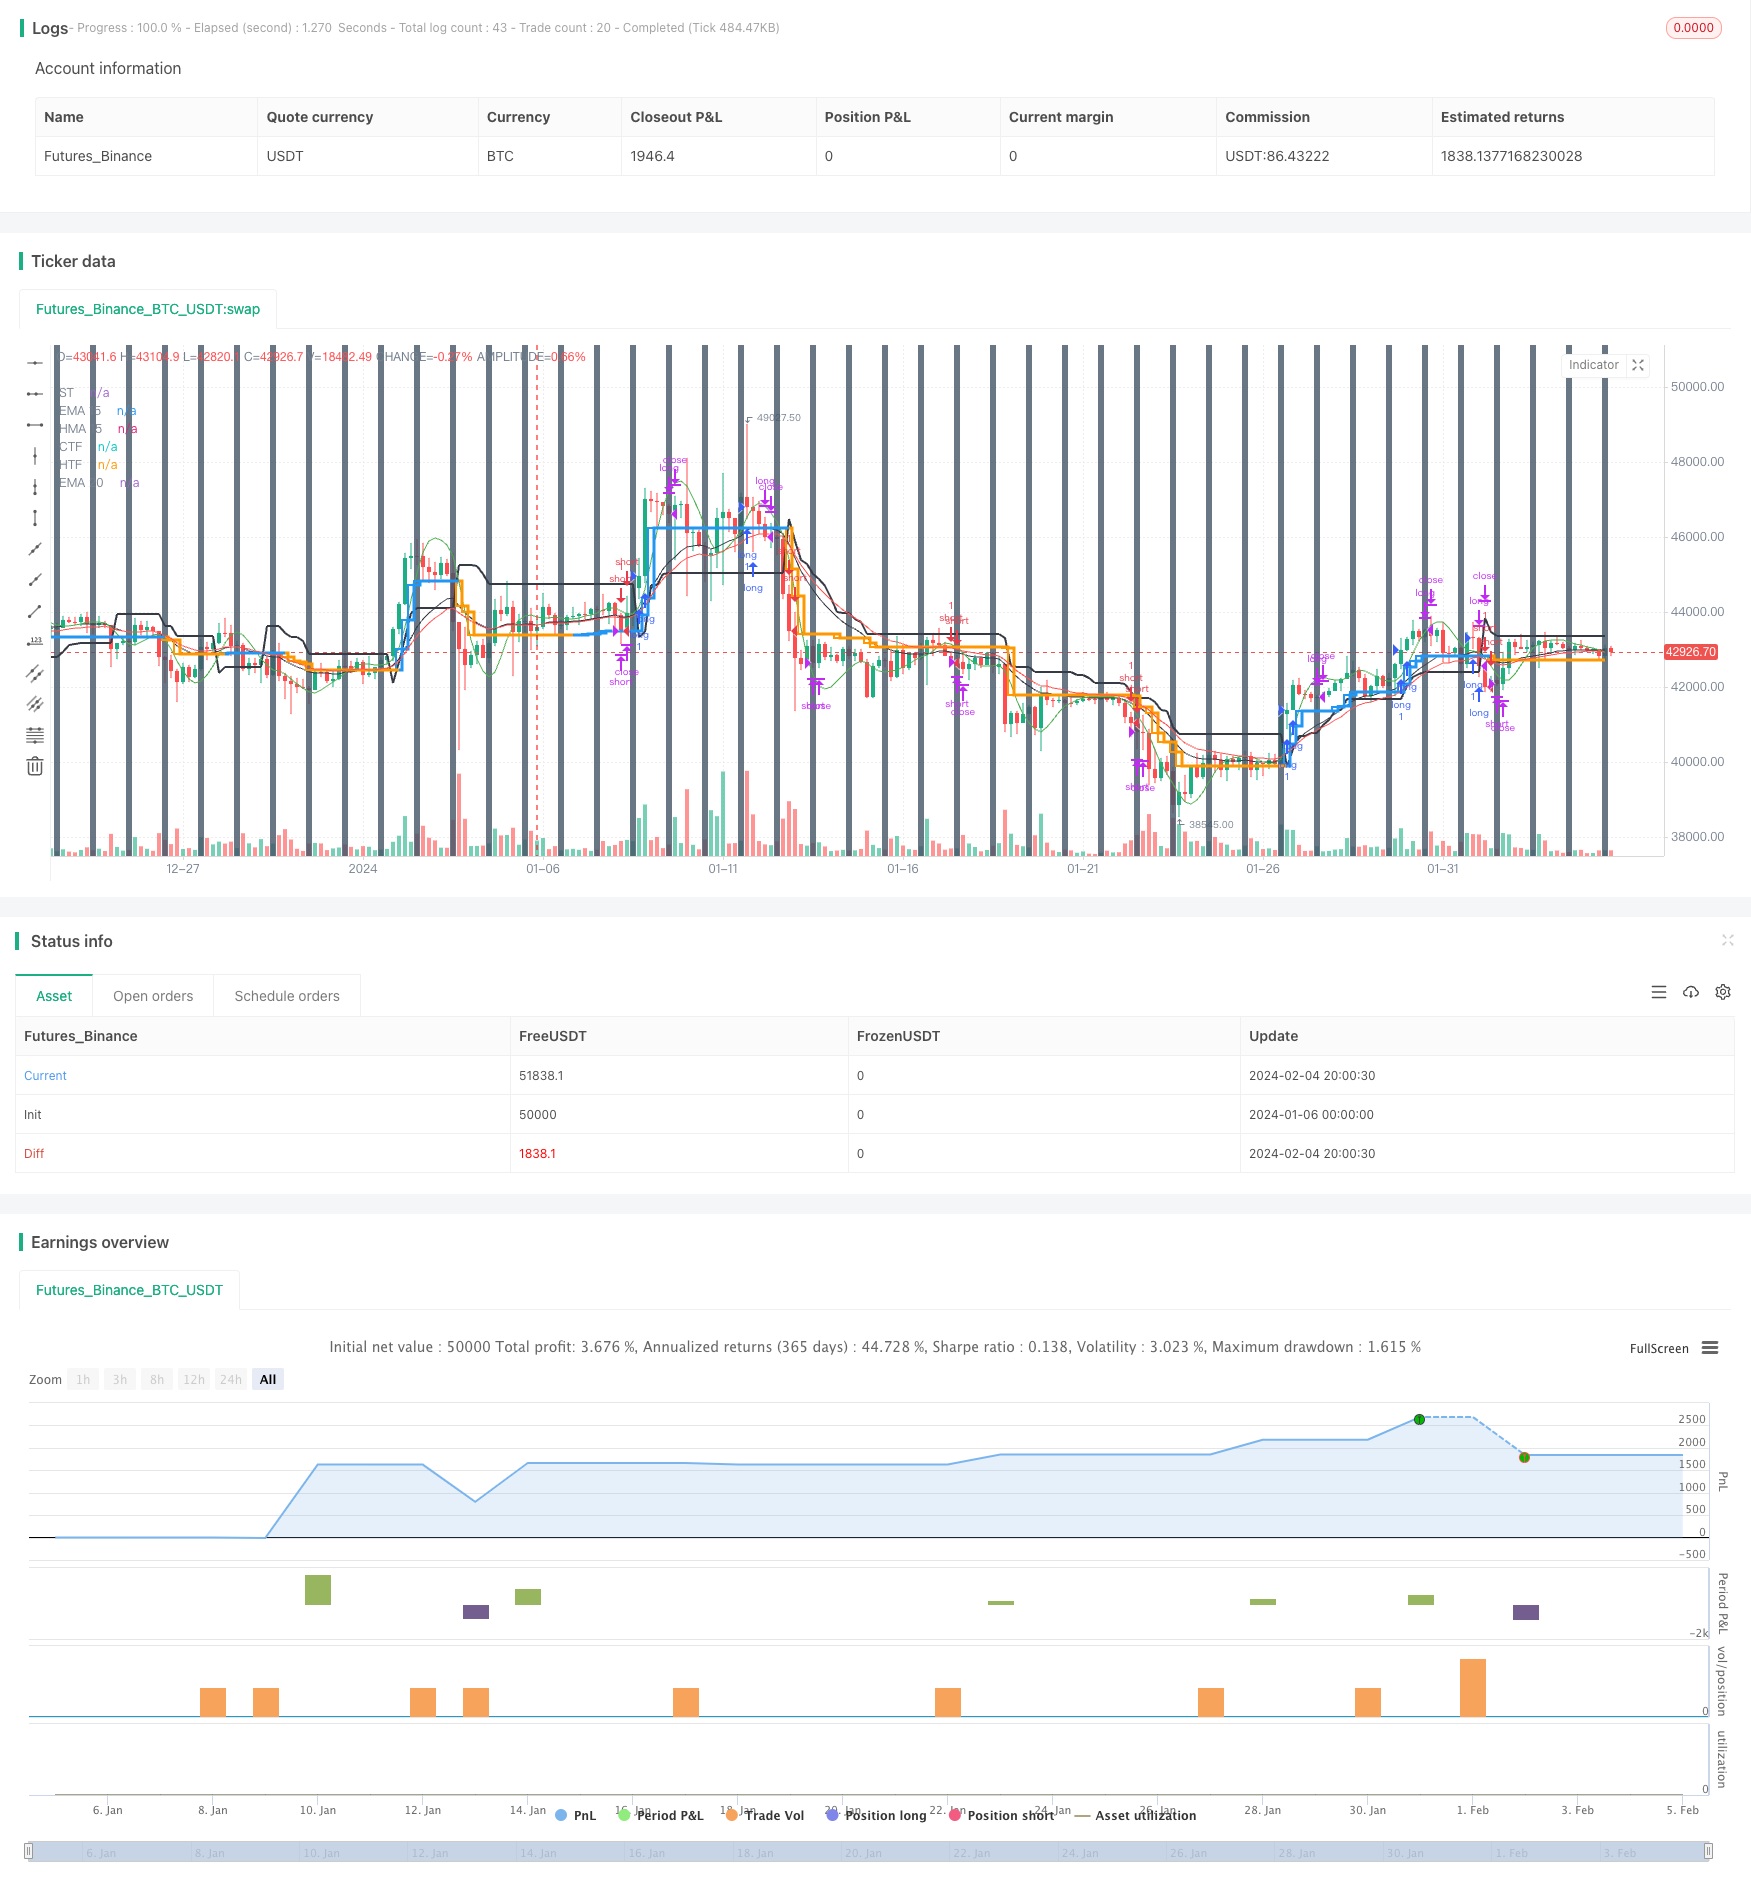
start: 2024-01-06 00:00:00
end: 2024-02-05 00:00:00
period: 4h
basePeriod: 15m
exchanges: [{"eid":"Futures_Binance","currency":"BTC_USDT"}]
*/
// This source code is subject to the terms of the Mozilla Public License 2.0 at https://mozilla.org/MPL/2.0/
// © ringashish
//@version=4
strategy("sa-strategy with HTF-TSL", overlay=true)
Pd = input(title="ATR Period", type=input.integer, defval=4)
Factor = input(title="ATR Multiplier", type=input.float, step=0.1, defval=2)
ST= supertrend(Factor, Pd)
heikinashi_close = security(heikinashi(syminfo.tickerid), timeframe.period, close)
heikinashi_low = security(heikinashi(syminfo.tickerid), timeframe.period, low)
heikinashi_open = security(heikinashi(syminfo.tickerid), timeframe.period, open)
heikinashi_high = security(heikinashi(syminfo.tickerid), timeframe.period, high)
heikinashi_close30 = security(heikinashi(syminfo.tickerid), "30", close)
//res1 = input("30", type=input.resolution, title="higher Timeframe")
//CCI TSL
res = input("240",type=input.resolution,title = "Higher Time Frame")
CCI = input(20)
ATR = input(5)
Multiplier=input(1,title='ATR Multiplier')
original=input(false,title='original coloring')
thisCCI = cci(close, CCI)
lastCCI = nz(thisCCI[1])
calcx()=>
bufferDn= high + Multiplier * sma(tr,ATR)
bufferUp= low - Multiplier * sma(tr,ATR)
if (thisCCI >= 0 and lastCCI < 0)
bufferUp := bufferDn[1]
if (thisCCI <= 0 and lastCCI > 0)
bufferDn := bufferUp[1]
if (thisCCI >= 0)
if (bufferUp < bufferUp[1])
bufferUp := bufferUp[1]
else
if (thisCCI <= 0)
if (bufferDn > bufferDn[1])
bufferDn := bufferDn[1]
x = 0.0
x := thisCCI >= 0 ?bufferUp:thisCCI <= 0 ?bufferDn:x[1]
x
tempx = calcx()
calcswap() =>
swap = 0.0
swap := tempx>tempx[1]?1:tempx<tempx[1]?-1:swap[1]
swap
tempswap = calcswap()
swap2=tempswap==1?color.blue:color.orange
swap3=thisCCI >=0 ?color.blue:color.orange
swap4=original?swap3:swap2
//display current timeframe's Trend
plot(tempx,"CTF",color=swap4,transp=0,linewidth=2, style = plot.style_stepline)
htfx = security(syminfo.tickerid,res,tempx[1],lookahead = barmerge.lookahead_on)
htfswap4 = security(syminfo.tickerid,res,swap4[1],lookahead = barmerge.lookahead_on)
plot(htfx,"HTF",color=htfswap4,transp=0,linewidth=3,style = plot.style_stepline)
//supertrend
Supertrend(Factor, Pd) =>
Up=hl2-(Factor*atr(Pd))
Dn=hl2+(Factor*atr(Pd))
TrendUp = 0.0
TrendUp := heikinashi_close[1]>TrendUp[1] ? max(Up,TrendUp[1]) : Up
TrendDown = 0.0
TrendDown := heikinashi_close[1]<TrendDown[1]? min(Dn,TrendDown[1]) : Dn
Trend = 0.0
Trend := heikinashi_close > TrendDown[1] ? 1: heikinashi_close< TrendUp[1]? -1: nz(Trend[1],1)
Tsl = Trend==1? TrendUp: TrendDown
S_Buy = Trend == 1 ? 1 : 0
S_Sell = Trend != 1 ? 1 : 0
[Trend, Tsl]
[Trend,Tsl] = Supertrend(Factor, Pd)
// Security
//ST1_Trend_MTF = security(syminfo.tickerid, res1, Tsl,barmerge.lookahead_on)
//plot(ST1_Trend_MTF, "higher ST")
crossdn = crossunder(heikinashi_close,Tsl) or crossunder(heikinashi_close[1],Tsl) or crossunder(heikinashi_close[2],Tsl) or heikinashi_close < Tsl
crossup = crossover(heikinashi_close,Tsl) or crossover(heikinashi_close[1],Tsl) or crossover(heikinashi_close[2],Tsl) or heikinashi_close > Tsl
plot(Tsl,"ST",color = color.black,linewidth =2)
plot(ema(heikinashi_close,20),"EMA 20",color=color.red)
plot(hma(heikinashi_close,15),"HMA 15",color=color.green)
plot(ema(heikinashi_close,15),"EMA 15",color=color.black)
closedown = (heikinashi_close < hma(heikinashi_close,15) and heikinashi_high > hma(heikinashi_close,15)) or(heikinashi_close < ema(heikinashi_close,20) and heikinashi_high > ema(heikinashi_close,20))
closeup = (heikinashi_close > hma(heikinashi_close,15) and heikinashi_low < hma(heikinashi_close,15)) or (heikinashi_close > ema(heikinashi_close,20) and heikinashi_low < ema(heikinashi_close,20))
buy = heikinashi_open == heikinashi_low and closeup and crossup and close > htfx
//buy = heikinashi_open == heikinashi_low and heikinashi_close > ema(close,20) and heikinashi_low < ema(close,20) and crossup
buyexit = cross(close,tempx) //heikinashi_open == heikinashi_high //and heikinashi_close < ema(close,15) and heikinashi_high > ema(close,15)
//if heikinashi_close30[1] < ST1_Trend_MTF
//sell = heikinashi_open == heikinashi_high and heikinashi_close < ema(close,20) and heikinashi_high > ema(close,20) and rsi(close,14)<60 and crossdn
sell = heikinashi_open == heikinashi_high and closedown and rsi(close,14)<55 and crossdn and close < htfx
sellexit = cross(close,tempx) //heikinashi_open == heikinashi_low //and heikinashi_close > ema(close,15) and heikinashi_low < ema(close,15)
rg = 0
rg := buy ? 1 : buyexit ? 2 : nz(rg[1])
longLogic = rg != rg[1] and rg == 1
longExit = rg != rg[1] and rg == 2
//plotshape(longExit,"exit buy",style = shape.arrowup,location = location.belowbar,color = color.red, text ="buy exit", textcolor = color.red)
//plotshape(longLogic,"BUY",style = shape.arrowup,location = location.belowbar,color = color.green, text ="buy", textcolor= color.green)
nm = 0
nm := sell ? 1 : sellexit ? 2 : nz(nm[1])
shortLogic = nm != nm[1] and nm == 1
shortExit = nm != nm[1] and nm == 2
//plotshape(shortExit,"exit sell",style = shape.arrowup,location = location.belowbar,color = color.red, text ="sell exit", textcolor = color.red)
//plotshape(shortLogic,"SELL",style = shape.arrowup,location = location.belowbar,color = color.green, text ="sell", textcolor= color.green)
//Exit at particular time
ExitHour = input(title="Exit Hour Of Day", type=input.integer, defval=15, step = 5, maxval = 24, minval = 0)
ExitMint = input(title="Exit Minute Of Day", type=input.integer, defval=15, step = 5, maxval = 24, minval = 0)
bgc = input(title="Highlight Background Color?", type=input.bool, defval=true)
mRound(num,rem) => (floor(num/rem)*rem)
exitTime = (hour(time) >= ExitHour and (minute == mRound(ExitMint, timeframe.multiplier))) ? 1 : 0
exitTime := exitTime == 0 ? (hour(time) >= ExitHour and (minute + timeframe.multiplier >= ExitMint)) ? 1 : 0 : exitTime
MarketClose = exitTime and not exitTime[1]
alertcondition(exitTime and not exitTime[1], title="Intraday Session Close Time", message="Close All Positions")
bgcolor(exitTime and not exitTime[1] and bgc ? #445566 : na, transp =40)
longCondition = longLogic
if (longCondition)
strategy.entry("long", strategy.long)
shortCondition = shortLogic
if (shortCondition)
strategy.entry("short", strategy.short)
strategy.close("short", when =cross(close,tempx) or MarketClose)
strategy.close( "long", when =cross(close,tempx) or MarketClose )