Strategi Penembusan Tren Bulanan

Ringkasan
Strategi trend breakout bulanan adalah indikator TradingView yang didasarkan pada naskah pine. Strategi ini menggunakan kombinasi rata-rata bergerak yang disesuaikan, trend line breakout, dan indikator RSI untuk menentukan waktu masuk ke pasar yang lebih tinggi hanya sekali sebulan.
Prinsip Strategi
-
Definisi variabel lastEntryMonth mencatat satu entri bulan sebelumnya.
-
Set TRAMA untuk mengadaptasi parameter moving average length=99, untuk meluruskan harga dan menilai arah tren.
-
Tetapkan parameter length_trend=14, untuk menggambar garis tren yang tinggi upper. Ketika harga naik melewati garis tren, dinilai sebagai pecah.
-
Perhitungan parameter indikator RSI rsiLength=14, untuk menilai overbought overbought.
-
Logika masuk: Jika Anda tidak masuk bulan lalu, masuklah lebih banyak ketika harga penutupan lebih tinggi dari TRAMA dan harga penutupan terobosan.
-
Logika Keluar: Bila RSI lebih besar dari 70, maka posisi kosong.
-
Menggambar kurva TRAMA, garis overbought RSI, dan menyelesaikan strategi.
Strategi ini menggabungkan tiga indikator teknologi utama untuk menilai tren, momentum, dan overbought oversold, mencari kesempatan untuk melakukan lebih banyak risiko yang lebih rendah hanya sekali per bulan. Pada saat yang sama, pembatasan hanya berlaku jika harga menembus tren naik, untuk menghindari operasi yang tidak efektif di zona konsolidasi.
Analisis Keunggulan
-
Kombinasi berbagai indikator, penilaian komprehensif terhadap kondisi pasar, meningkatkan akurasi pengambilan keputusan.
-
Hanya masuk pada saat batas waktu bulanan terputus, hindari perdagangan yang sering.
-
Adaptasi rata-rata bergerak dapat digunakan untuk menentukan arah tren dan menangkap perubahan dengan cepat.
-
Menghindari posisi pasar yang tinggi, dan mengontrol risiko secara efektif dengan indikator overbought.
-
Syarat masuk dan keluar yang sederhana dan mudah dipahami.
-
Ada juga beberapa fitur yang bisa digunakan untuk mengoptimalkan strategi yang lebih baik.
Analisis risiko
-
Risiko whipsaw dari kegagalan penembusan. Setelah masuk, harga kembali tergelincir dan dapat menyebabkan kerugian.
-
Tidak ada pilihan yang baik untuk melakukan penembusan tren, yang akan memilih untuk masuk ke posisi tinggi di dekat puncak.
-
Parameter indikator tidak disetel dengan benar, menyebabkan indikator menghasilkan sinyal yang salah.
-
Penembusan hanya Reflect recent market volatility. Consider adaptive stops/position sizing.
-
Monitor risk/reward. Consider only trading pullbacks or adding other confirmation filters.
-
Validate indicators on multiple timeframes. Use higher timeframes to identify trend and lower for entry.
-
Backtest over different market conditions. Optimize parameters to match strategy to market type.
Arah optimasi
-
Menambahkan Volume, MA mengkonfirmasi indikator volume transaksi, menghindari jumlah rendah dari false breakout.
-
Ketika RSI membeli lebih dari posisi terendah, pertimbangkan sebagian stop loss keuntungan dan simpan sisa posisi.
-
Optimalkan parameter moving average, beradaptasi dengan perubahan, dan lebih baik melacak konversi tren.
-
Buat jarak sebelum dan sesudah titik terobosan, hindari masuk langsung pada titik tinggi di titik balik.
-
Menambahkan lebih banyak kondisi penyaringan, seperti indikator channel, indikator volatilitas, dan lain-lain, untuk meningkatkan akurasi pengambilan keputusan.
-
Jika harga terus menerus menembus garis resistensi baru, maka Anda dapat meningkatkan posisi Anda.
Meringkaskan
Strategi peretasan tren bulanan mempertimbangkan berbagai faktor seperti tren, energi, dan kondisi batas. Ini menilai arah tren pada kerangka waktu bulan dan menggabungkan penembusan pada kerangka waktu yang lebih rendah. Pada saat yang sama, penggunaan indikator RSI secara efektif mengendalikan risiko perdagangan.
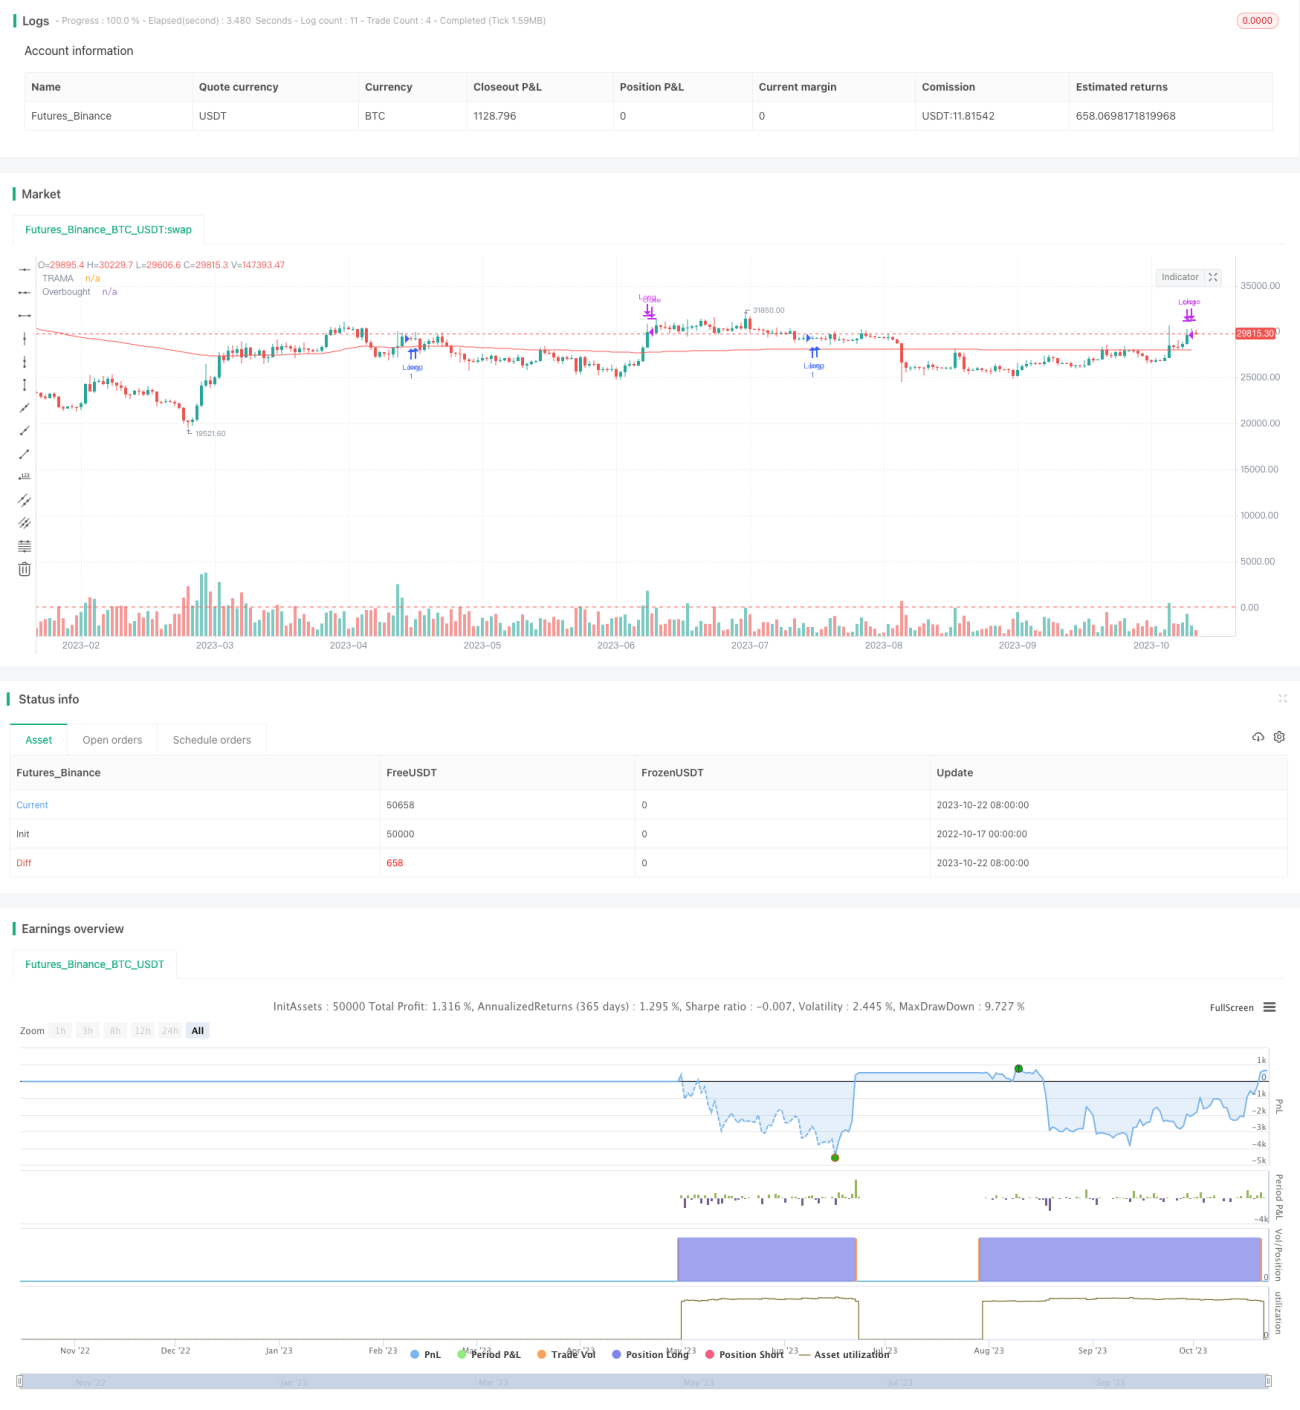
/*backtest
start: 2022-10-17 00:00:00
end: 2023-10-23 00:00:00
period: 1d
basePeriod: 1h
exchanges: [{"eid":"Futures_Binance","currency":"BTC_USDT"}]
*/

//@version=5
strategy('Bannos Strategy', shorttitle='Bannos', overlay=true)

//The provided script is an indicator for TradingView written in Pine Script version 5. The indicator is used to determine entry and exit points for a trading strategy. Here's a detailed breakdown of what the script does:- 1