Strategi Breakout Volatilitas Dinamis

Ringkasan
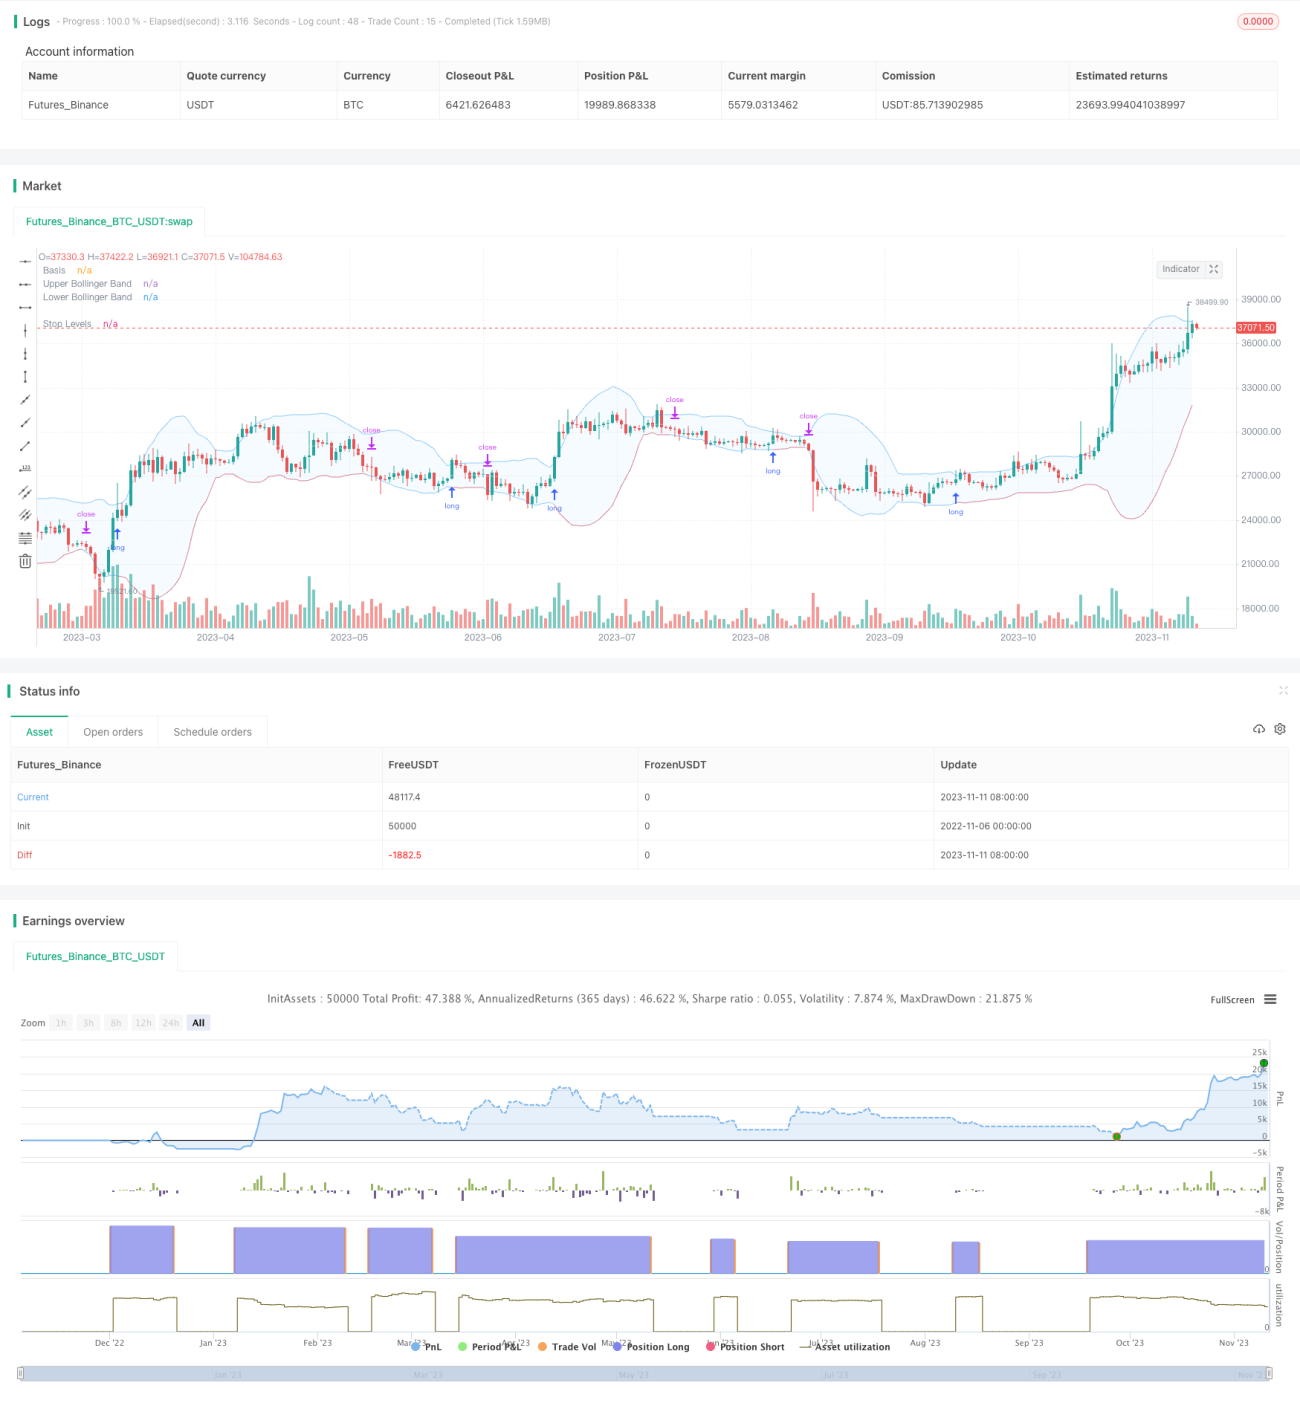
Strategi ini memanfaatkan tren naik turun yang dinamis di Bollinger Bands, untuk mencapai posisi lebih tinggi ketika harga menembus tren naik Bollinger Bands, dan posisi rata ketika harga turun di bawah tren Bollinger Bands. Berbeda dengan strategi penembusan tradisional, tren naik turun Bollinger Bands akan berubah berdasarkan dinamika fluktuasi historis, sehingga lebih baik untuk menilai keadaan pasar yang terlalu banyak membeli dan terlalu banyak menjual.
Prinsip Strategi
Strategi ini terutama bergantung pada penembusan harga dalam indikator Brin Belt. Brin Belt terdiri dari tiga garis:
- Garis tengah: rata-rata bergerak n hari
- Jalur atas: garis tengah + k * n hari standar perbedaan
- Garis bawah: garis tengah - k * n hari standar perbedaan
Ketika harga naik melebihi tren naik, menganggap bahwa pasar berada dalam kondisi overbuy, dapat dilakukan lebih banyak. Ketika harga turun melebihi tren turun, menganggap bahwa pasar berada dalam kondisi oversold, harus dihapus.
Kebijakan ini memungkinkan untuk menyesuaikan parameter Brinet: panjang garis tengah n dan kelipatan dari perbedaan standar k. Default panjang garis tengah adalah 20 hari dan perbedaan standar adalah kelipatan 2.
Setelah saham ditutup setiap hari, akan diperiksa apakah harga penutupan hari itu telah menerobos ke atas. Jika demikian, maka akan dilakukan sinyal plus pada hari berikutnya. Setelah melakukan plus, akan dipantau secara real time apakah harga telah menerobos ke bawah, dan jika telah menerobos maka akan dihapus.
Strategi ini juga memperkenalkan filter rata-rata, yang hanya akan menghasilkan sinyal ganda jika harga lebih tinggi dari rata-rata. Anda dapat memilih untuk memetakan rata-rata pada periode saat ini atau periode yang lebih tinggi untuk mengontrol titik waktu masuk.
Stop loss juga menawarkan dua pilihan: stop loss persentase tetap atau track down Brin. Yang terakhir dapat memberikan ruang yang lebih besar untuk menjalankan keuntungan.
Keunggulan Strategis
- SUPERBUY/SUPPERSELL menggunakan pita Brin untuk menilai pasar
- Filter rata-rata untuk menghindari perdagangan berlawanan
- Parameter pita Brin yang dapat disesuaikan untuk siklus yang berbeda
- Ada dua opsi untuk menghentikan kerugian
- Mendukung parameter pengoptimalan feedback, strategi verifikasi langsung
Risiko Strategis
- Blinken tidak bisa sepenuhnya menilai overbuying dan overselling.
- Filter rata-rata mungkin melewatkan kesempatan untuk terobosan lebih cepat
- Stop loss tetap mungkin terlalu konservatif, stop loss tracking mungkin terlalu radikal
- Parameter yang perlu dioptimalkan untuk varietas dan siklus yang berbeda
- Tidak ada batasan untuk ukuran kerugian, harus mempertimbangkan pengelolaan dana
Optimasi Strategi
- Uji kombinasi parameter rata-rata yang berbeda
- Mencoba berbagai parameter Brinet
- Bandingkan persentase stop loss yang tetap dengan stop loss yang dilacak
- Menambahkan Modul Manajemen Uang untuk Membatasi Kerugian Tunggal
- Sinyal pita Brin digabungkan dengan indikator lain untuk verifikasi
Meringkaskan
Strategi ini memanfaatkan tren naik turun yang dinamis dari Brin Belt untuk menilai overbought dan oversold, merujuk pada sinyal penyaringan linear, menggunakan dana perlindungan stop loss. Dibandingkan dengan terobosan orbit tetap tradisional, lebih dapat beradaptasi dengan fluktuasi pasar. Dengan pengoptimalan parameter dan kontrol risiko, stabilitas dan tingkat pengembalian strategi dapat ditingkatkan lebih lanjut. Secara keseluruhan, strategi ini memanfaatkan karakteristik dinamis dari Brin Belt dan mengambil keuntungan dari strategi terobosan yang layak untuk verifikasi saham dan pengoptimalan pelacakan jangka panjang.
- 1