Strategi Panah Crossover Rata-rata Bergerak Ganda

Ringkasan
Strategi ini menentukan kapan harus membeli dan menjual dengan menghitung crossover MACD. Strategi ini memetakan bentuk panah pada grafik untuk memberi sinyal perdagangan.
Prinsip
Strategi ini pertama-tama menghitung garis cepat (EMA 12), garis lambat (EMA 26), dan MACD. Kemudian, berdasarkan garis cepat dan garis lambat, dan nilai positif-negatif dari MACD untuk menentukan waktu beli dan jual:
- Ketika garis cepat melewati garis lambat (goldfork) dan MACD diferensial melewati 0 sebagai sinyal beli
- Sinyal jual saat garis cepat melewati garis lambat (dead fork) dan MACD di bawah nilai 0
Untuk menyaring sinyal palsu, kode juga menilai status sinyal dari K-line sebelumnya. Hanya jika K-line saat ini adalah sinyal terbalik (atau membeli untuk menjual atau menjual untuk membeli), sinyal saat ini akan dipicu.
Selain itu, kode ini juga memetakan gambar panah di K-Line untuk menginstruksikan waktu pembelian dan penjualan.
Keunggulan
Strategi ini memiliki keuntungan sebagai berikut:
- Menggunakan penilaian crossover dua garis sejajar, dapat secara efektif menyaring kebisingan pasar dan mengidentifikasi tren
- Pengukuran MACD dapat mencegah kesalahan dalam pengukuran
- Dengan menggunakan panah, Anda bisa memperingatkan waktu untuk membeli dan menjual dengan lebih jelas.
- Peraturan sederhana dan jelas, mudah dipahami dan disalin
Risiko dan Solusi
Strategi ini juga memiliki beberapa risiko:
- Garis rata ganda mudah menghasilkan sinyal palsu, yang dapat menyebabkan overtrading. Parameter garis rata dapat disesuaikan dengan tepat atau menambahkan kondisi penyaringan lainnya untuk mengurangi sinyal palsu
- Tidak dapat menilai tren yang bergoyang, kemungkinan kerugian. Hal ini dapat dihindari dengan indikator tren seperti ADX
- Kondisi pembelian dan penjualan yang tetap membuat strategi menjadi mekanis, tidak dapat beradaptasi dengan perubahan pasar. Anda dapat mencoba metode adaptasi seperti pembelajaran mesin untuk mengoptimalkannya.
Arah optimasi
Strategi ini dapat dioptimalkan dari beberapa arah:
- Uji kombinasi parameter yang berbeda untuk menemukan garis cepat, lambat, dan parameter MACD terbaik
- Menambahkan persyaratan masuk, seperti volume transaksi yang menerobos untuk memfilter sinyal
- Menambahkan mekanisme stop loss untuk mengendalikan kerugian tunggal
- Indikator volatilitas seperti VIX untuk menilai preferensi risiko
- Mencoba model pembelajaran mesin untuk menggantikan aturan tetap, untuk mengoptimalkan strategi yang beradaptasi
Meringkaskan
Strategi cross arrow ini secara keseluruhan relatif sederhana dan praktis, dengan penilaian cross cross dan penyaringan MACD, Anda dapat mengidentifikasi titik jual beli dalam tren garis tengah dan panjang, dan menghindari perubahan harga yang terlewat. Petunjuk panah juga membuat operasi lebih jelas dan jelas.
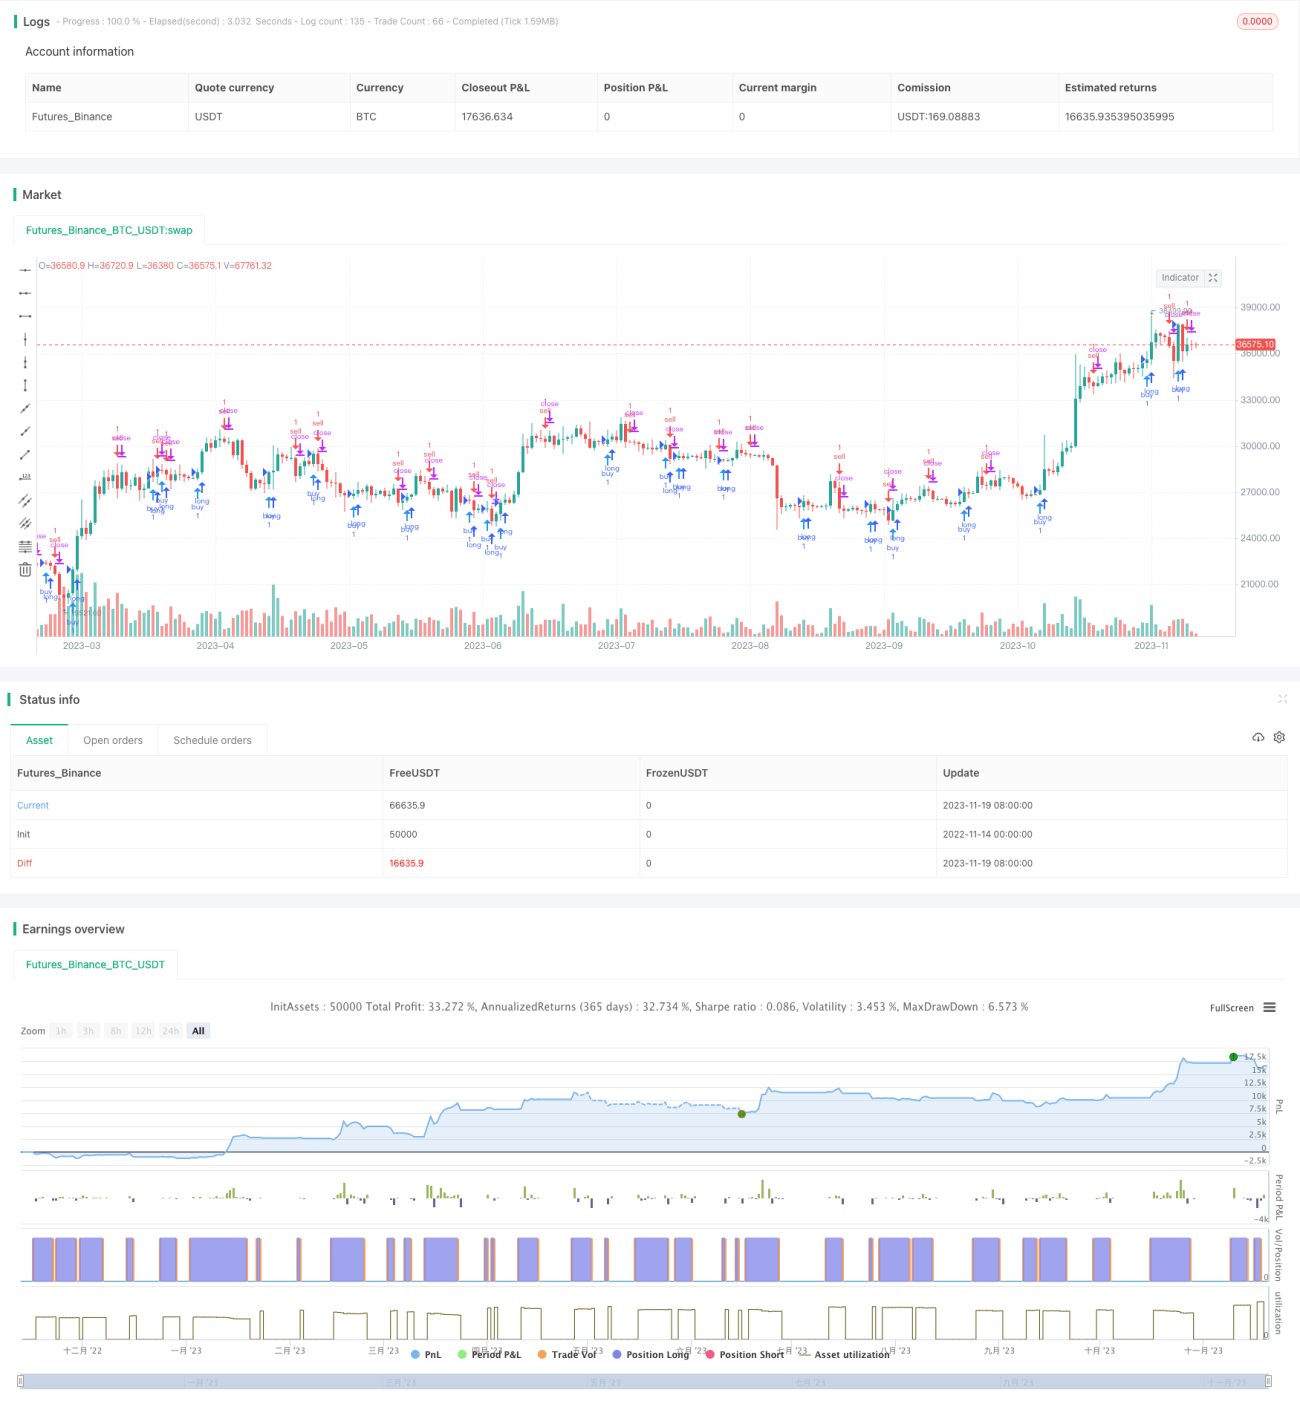
/*backtest
start: 2022-11-14 00:00:00
end: 2023-11-20 00:00:00
period: 1d
basePeriod: 1h
exchanges: [{"eid":"Futures_Binance","currency":"BTC_USDT"}]
*/

//@version=3
//Daniels stolen code
strategy(shorttitle="Daniels Stolen Code", title="Daniels Stolen Code", overlay=true, calc_on_order_fills=true, pyramiding=0)
- 1