
Ini adalah strategi yang menggunakan garis rata dan saluran Brin untuk menilai tren, dan menggabungkan prinsip penyaringan dan stop loss yang terobosan. Ini dapat menangkap sinyal tepat waktu saat tren berubah, mengurangi sinyal salah dengan penyaringan dua garis rata, dan mengatur stop loss untuk mengendalikan risiko.
Strategi ini terdiri dari beberapa bagian utama:
Pengertian tren: Menggunakan MACD untuk menentukan tren harga, membedakan antara tren multihead dan tren kosong.
Filter Range: Menggunakan saluran Brining untuk menentukan kisaran fluktuasi harga, memfilter sinyal yang tidak melanggar kisaran.
Konfirmasi Garis Dua Rata: Garis dua rata yang terdiri dari EMA cepat dan EMA lambat, digunakan untuk mengkonfirmasi sinyal tren. Sinyal beli hanya dihasilkan ketika EMA cepat > EMA lambat.
Mekanisme Stop Loss: menetapkan titik stop loss, dan menghentikan posisi terdepan jika harga melewati titik stop loss ke arah yang tidak menguntungkan.
Logika penilaian sinyal masuk adalah:
Sinyal beli dihasilkan ketika ketiga kondisi di atas terpenuhi secara bersamaan.
Logika leveling terdiri dari dua jenis, stop-billing leveling dan stop-loss leveling. Stop-billing adalah harga masuk yang dikalikan dengan proporsi tertentu, dan stop-loss adalah harga masuk yang dikalikan dengan proporsi tertentu.
Strategi ini memiliki keuntungan sebagai berikut:
Strategi ini juga memiliki beberapa risiko:
Risiko ini dapat dioptimalkan dan ditingkatkan dengan cara mengoptimalkan parameter, menyesuaikan posisi stop loss, dan sebagainya.
Strategi ini dapat dioptimalkan dari beberapa arah:
Dengan menguji berbagai pengaturan parameter, evaluasi tingkat pengembalian dan rasio Sharpe, strategi dapat ditemukan dalam kondisi optimal.
Ini adalah strategi kuantitatif yang memanfaatkan penilaian tren, penyaringan jangkauan, pengesahan garis ganda, dan pemikiran stop loss. Ini dapat secara efektif menilai arah tren dan menemukan keseimbangan antara penghematan keuntungan dan pengendalian risiko. Dengan cara seperti pengoptimalan parameter dan pembelajaran mesin, strategi ini memiliki banyak ruang untuk perbaikan dan dapat memberikan hasil yang lebih baik.
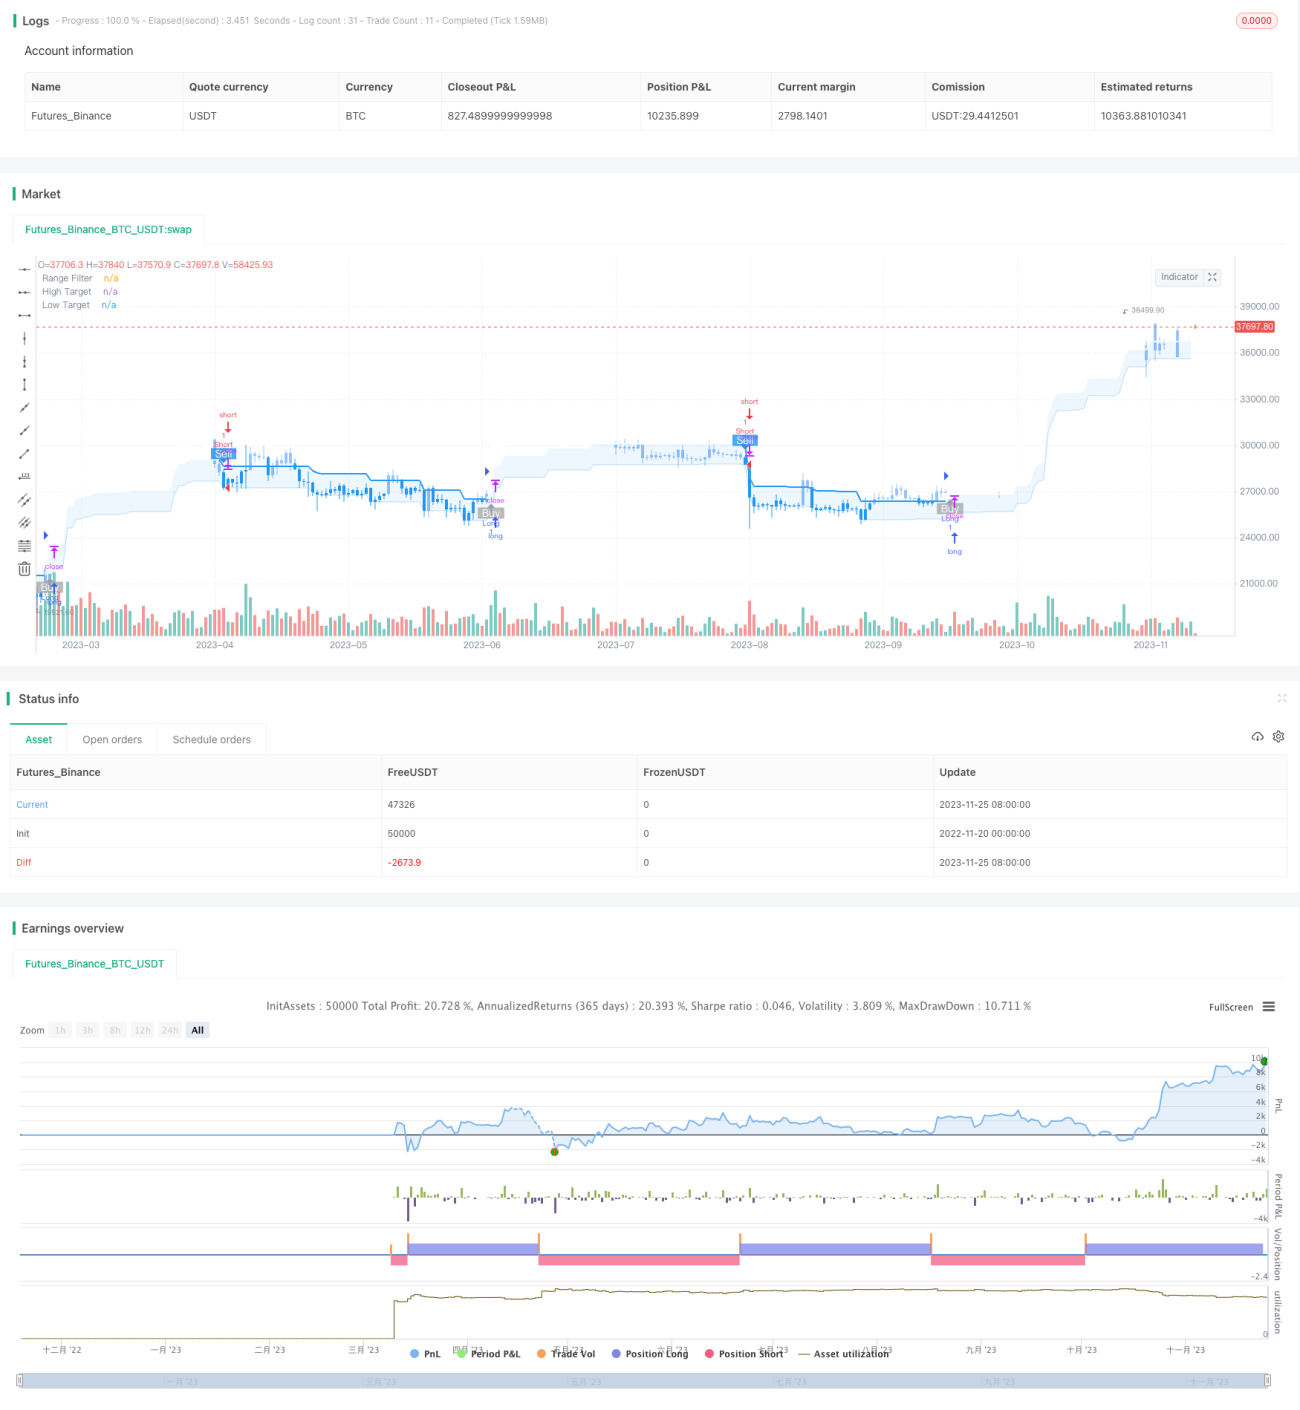
/*backtest
start: 2022-11-20 00:00:00
end: 2023-11-26 00:00:00
period: 1d
basePeriod: 1h
exchanges: [{"eid":"Futures_Binance","currency":"BTC_USDT"}]
*/
//@version=5
strategy(title="Range Filter Buy and Sell Strategies", shorttitle="Range Filter Strategies", overlay=true,pyramiding = 5)
// Original Script > @DonovanWall
// Adapted Version > @guikroth
//
// Updated PineScript to version 5
// Republished by > @tvenn
// Strategizing by > @RonLeigh
//////////////////////////////////////////////////////////////////////////
// Settings for 5min chart, BTCUSDC. For Other coin, change the parameters
//////////////////////////////////////////////////////////////////////////
SS = input.bool(false,"Percentage Take Profit Stop Loss")
longProfitPerc = input.float(title='LongProfit(%)', minval=0.0, step=0.1, defval=1.5) * 0.01
shortProfitPerc = input.float(title='ShortProfit(%)', minval=0.0, step=0.1, defval=1.5) * 0.01
longLossPerc = input.float(title='LongStop(%)', minval=0.0, step=0.1, defval=1.5) * 0.01
shortLossPerc = input.float(title='ShortStop(%)', minval=0.0, step=0.1, defval=1.5) * 0.01
// Color variables
upColor = color.white
midColor = #90bff9
downColor = color.blue
// Source
src = input(defval=close, title="Source")
// Sampling Period
// Settings for 5min chart, BTCUSDC. For Other coin, change the paremeters
per = input.int(defval=100, minval=1, title="Sampling Period")
// Range Multiplier
mult = input.float(defval=3.0, minval=0.1, title="Range Multiplier")
// Smooth Average Range
smoothrng(x, t, m) =>
wper = t * 2 - 1
avrng = ta.ema(math.abs(x - x[1]), t)
smoothrng = ta.ema(avrng, wper) * m
smoothrng
smrng = smoothrng(src, per, mult)
// Range Filter
rngfilt(x, r) =>
rngfilt = x
rngfilt := x > nz(rngfilt[1]) ? x - r < nz(rngfilt[1]) ? nz(rngfilt[1]) : x - r :
x + r > nz(rngfilt[1]) ? nz(rngfilt[1]) : x + r
rngfilt
filt = rngfilt(src, smrng)
// Filter Direction
upward = 0.0
upward := filt > filt[1] ? nz(upward[1]) + 1 : filt < filt[1] ? 0 : nz(upward[1])
downward = 0.0
downward := filt < filt[1] ? nz(downward[1]) + 1 : filt > filt[1] ? 0 : nz(downward[1])
// Target Bands
hband = filt + smrng
lband = filt - smrng
// Colors
filtcolor = upward > 0 ? upColor : downward > 0 ? downColor : midColor
barcolor = src > filt and src > src[1] and upward > 0 ? upColor :
src > filt and src < src[1] and upward > 0 ? upColor :
src < filt and src < src[1] and downward > 0 ? downColor :
src < filt and src > src[1] and downward > 0 ? downColor : midColor
filtplot = plot(filt, color=filtcolor, linewidth=2, title="Range Filter")
// Target
hbandplot = plot(hband, color=color.new(upColor, 70), title="High Target")
lbandplot = plot(lband, color=color.new(downColor, 70), title="Low Target")
// Fills
fill(hbandplot, filtplot, color=color.new(upColor, 90), title="High Target Range")
fill(lbandplot, filtplot, color=color.new(downColor, 90), title="Low Target Range")
// Bar Color
barcolor(barcolor)
// Break Outs
longCond = bool(na)
shortCond = bool(na)
longCond := src > filt and src > src[1] and upward > 0 or
src > filt and src < src[1] and upward > 0
shortCond := src < filt and src < src[1] and downward > 0 or
src < filt and src > src[1] and downward > 0
CondIni = 0
CondIni := longCond ? 1 : shortCond ? -1 : CondIni[1]
longCondition = longCond and CondIni[1] == -1
shortCondition = shortCond and CondIni[1] == 1
// alertcondition(longCondition, title="Buy alert on Range Filter", message="Buy alert on Range Filter")
// alertcondition(shortCondition, title="Sell alert on Range Filter", message="Sell alert on Range Filter")
// alertcondition(longCondition or shortCondition, title="Buy and Sell alert on Range Filter", message="Buy and Sell alert on Range Filter")
////////////// 副
sensitivity = input(150, title='Sensitivity')
fastLength = input(20, title='FastEMA Length')
slowLength = input(40, title='SlowEMA Length')
channelLength = input(20, title='BB Channel Length')
multt = input(2.0, title='BB Stdev Multiplier')
DEAD_ZONE = nz(ta.rma(ta.tr(true), 100)) * 3.7
calc_macd(source, fastLength, slowLength) =>
fastMA = ta.ema(source, fastLength)
slowMA = ta.ema(source, slowLength)
fastMA - slowMA
calc_BBUpper(source, length, multt) =>
basis = ta.sma(source, length)
dev = multt * ta.stdev(source, length)
basis + dev
calc_BBLower(source, length, multt) =>
basis = ta.sma(source, length)
dev = multt * ta.stdev(source, length)
basis - dev
t1 = (calc_macd(close, fastLength, slowLength) - calc_macd(close[1], fastLength, slowLength)) * sensitivity
e1 = calc_BBUpper(close, channelLength, multt) - calc_BBLower(close, channelLength, multt)
trendUp = t1 >= 0 ? t1 : 0
trendDown = t1 < 0 ? -1 * t1 : 0
duoad = trendUp > 0 and trendUp > e1
kongad = trendDown > 0 and trendDown > e1
duo = longCondition and duoad
kong = shortCondition and kongad
//Alerts
plotshape(longCondition and trendUp > e1 and trendUp > 0 , title="Buy Signal", text="Buy", textcolor=color.white, style=shape.labelup, size=size.small, location=location.belowbar, color=color.new(#aaaaaa, 20))
plotshape(shortCondition and trendDown > e1 and trendDown > 0 , title="Sell Signal", text="Sell", textcolor=color.white, style=shape.labeldown, size=size.small, location=location.abovebar, color=color.new(downColor, 20))
if longCondition and trendUp > e1 and trendUp > 0
strategy.entry('Long',strategy.long, comment = "buy" )
if shortCondition and trendDown > e1 and trendDown > 0
strategy.entry('Short',strategy.short, comment = "sell" )
longlimtPrice = strategy.position_avg_price * (1 + longProfitPerc)
shortlimtPrice = strategy.position_avg_price * (1 - shortProfitPerc)
longStopPrice = strategy.position_avg_price * (1 - longLossPerc)
shortStopPrice = strategy.position_avg_price * (1 + shortLossPerc)
if (strategy.position_size > 0) and SS == true
strategy.exit(id="Long",comment_profit = "Profit",comment_loss = "StopLoss", stop=longStopPrice,limit = longlimtPrice)
if (strategy.position_size < 0) and SS == true
strategy.exit(id="Short",comment_profit = "Profit",comment_loss = "StopLoss", stop=shortStopPrice,limit = shortlimtPrice)