Strategi Turtle MACD Multi-Level Bollinger Band

Ringkasan
Strategi ini menggabungkan indikator MACD dengan indikator Borean Channel, ditambah dengan hukum perdagangan acuan untuk membentuk sistem penilaian multi-tingkat, yang bertujuan untuk meningkatkan profitabilitas strategi sekaligus mengendalikan risiko.
Prinsip Strategi
-
Menggunakan indikator MACD untuk menilai tren potensial, dan mengindikasikan overbought dan oversold.
-
N-value breakthrough dalam hukum perdagangan pelaut membentuk mekanisme tracking stop loss, untuk lebih mengunci keuntungan, dan mengendalikan risiko.
-
Menggunakan fitur Brinks, menyesuaikan rasio posisi pertama yang dibuka, kemudian menggunakan prinsip kenaikan posisi hukum perdagangan pantai, menerapkan perbedaan posisi terbuka dan berhenti, memperluas ruang keuntungan.
Analisis Keunggulan
-
Indikator MACD memiliki kemampuan penilaian tren yang lebih kuat, indikator Brinch channel efektif menilai situasi overbought dan oversold, keduanya digabungkan untuk membentuk sistem penilaian yang lebih akurat.
-
Mekanisme tracking stop loss dalam hukum perdagangan pelaut, dapat mengunci keuntungan dengan lebih baik dan menghindari penarikan balik yang terlalu dalam.
-
Di sisi lain, dalam hal ini, jika Anda memiliki lebih banyak peluang, Anda dapat memperluas peluang Anda dengan mengontrol risiko.
Analisis risiko
-
Parameter saluran Brin tidak disetel dengan benar, kemungkinan kehilangan peluang atau menambahkan sinyal yang salah.
-
Penetapan nilai N dalam aturan perdagangan acuan perlu dilakukan dengan hati-hati, terlalu besar atau terlalu kecil dapat mempengaruhi kinerja strategi.
-
"Saya tidak tahu apa-apa, saya tidak tahu apa-apa, saya tidak tahu apa-apa, saya tidak tahu apa-apa, saya tidak tahu apa-apa, saya tidak tahu apa-apa".
Arah optimasi
-
Adaptasi parameter Brinks, optimalisasi lebar Brinks, dan peningkatan peluang keuntungan.
-
Uji berbagai ukuran N untuk menemukan posisi stop loss yang optimal.
-
Mengoptimalkan tingkat dan frekuensi kenaikan posisi, mengurangi risiko dengan jaminan keuntungan.
Meringkaskan
Strategi ini menggunakan tiga alat kuantitatif utama, yaitu MACD, Brinch Channel, dan Forex, untuk menemukan kecocokan terbaik dengan menyesuaikan parameter, membentuk sistem indikator penilaian. Dengan demikian, keunggulan masing-masing alat dapat dimanfaatkan sepenuhnya, saling melengkapi, dan meningkatkan kinerja sistem bersama. Strategi ini juga menyiapkan mekanisme stop loss yang ketat dan penambahan risiko yang tepat, yang menjamin kecocokan risiko-penghasilan sambil mengejar keuntungan yang lebih tinggi.
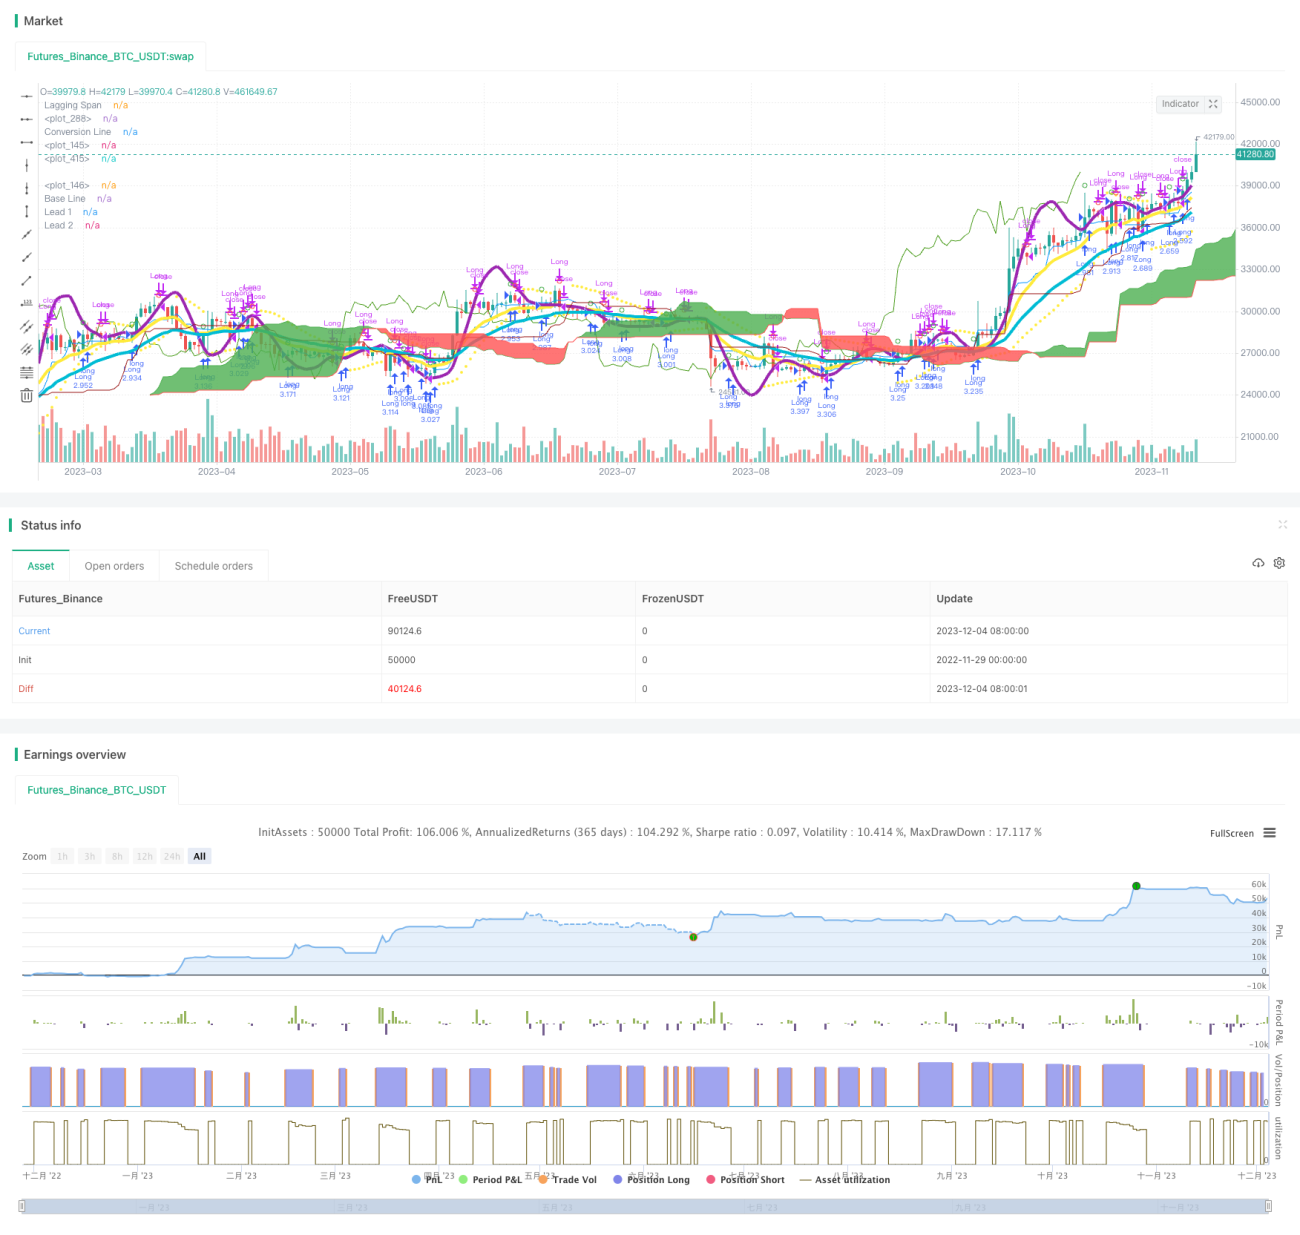
/*backtest
start: 2022-11-29 00:00:00
end: 2023-12-05 00:00:00
period: 1d
basePeriod: 1h
exchanges: [{"eid":"Futures_Binance","currency":"BTC_USDT"}]
*/

//@version=3
strategy("Tagmaniak MACD Algo", shorttitle="Tagmaniak MACD Algo", overlay=true, pyramiding = 0, default_qty_type = strategy.percent_of_equity, default_qty_value = 100, initial_capital=7000, calc_on_order_fills = true, commission_type=strategy.commission.percent, commission_value=0, currency = currency.USD)
//study("MFI Fresh", shorttitle="MFI Fresh", overlay=true)
- 1