Strategi Pantulan Rata-rata Bergerak

Tinjauan Strategi
Strategi bouncing moving average adalah sebuah strategi yang melacak harga untuk menembus moving average. Strategi ini memeriksa apakah pilar bouncing back dari bawah moving average, jika ya, itu adalah sinyal multihead; jika pilar bouncing back dari arah atas moving average, itu adalah sinyal headless.
Nama kebijakan
Exponential Moving Average Bounce Strategy
Prinsip Strategi
Strategi ini didasarkan pada rata-rata bergerak eksponensial. Ini akan menghitung garis EMA secara real-time. Kemudian periksa apakah harga bouncing di atas atau di bawah garis EMA:
- Jika harga jatuh di bawah garis EMA dan kemudian naik kembali di atas garis EMA, maka ini adalah sinyal multihead.
- Jika harga melewati garis EMA dan kemudian turun lagi untuk menutup di bawah garis EMA, itu adalah sinyal kosong.
Ini adalah sinyal masuk ke dalam strategi.
Analisis Keunggulan Strategi
Operasi lancar, hindari terjerat
Strategi bouncing EMA hanya masuk setelah menentukan bahwa harga berbalik, dan dapat menghindari operasi berlawanan arah.
Penarikan kecil, keuntungan historis
Karena menggunakan indeks moving average, yang dapat secara efektif meratakan data harga, memfilter kebisingan pasar, membuat strategi ini sedikit mundur, dan memberikan keuntungan historis yang lebih baik.
Mudah dimengerti, parameter dapat disesuaikan secara fleksibel
Strategi bouncing EMA hanya bergantung pada moving average, sangat sederhana dan mudah dipahami oleh pemula; sementara parameter siklus EMA dapat disesuaikan secara fleksibel untuk menyesuaikan dengan varietas yang berbeda.
Analisis risiko
Kemungkinan sinyal palsu
Seringkali ada penembusan palsu yang padat di dekat garis EMA, yang dapat menyebabkan sinyal yang salah. Parameter EMA harus disesuaikan untuk menyaring kebisingan ini.
Operasi berlanjut, tidak dapat memprediksi titik balik
Strategi ini pada dasarnya adalah operasi surplus. Tidak dapat memprediksi titik balik harga, hanya bisa mengejar tren. Ini mungkin waktu masuk terbaik yang terlewatkan untuk penyesuaian siklus.
Stop loss posisi mudah untuk ditembus
Stop loss di dekat moving average terkadang terjatuh, menyebabkan kerugian yang lebih besar. Hal ini memerlukan penggunaan stop loss yang lebih fleksibel.
Arah optimasi
Kombinasi sinyal filter dengan indikator lain
Indikator lain seperti RSI, MACD, dan lain-lain dapat ditambahkan untuk mengkonfirmasi pembalikan harga dan memfilter sinyal palsu.
Mengoptimalkan Stop Loss
Ada beberapa cara yang lebih fleksibel untuk mengurangi risiko terjatuh, seperti stop loss dengan waktu dan shock.
Optimasi parameter
Parameter siklus EMA dioptimalkan untuk menemukan kombinasi parameter yang optimal. Anda juga dapat mengubah parameter EMA secara dinamis untuk melacak siklus pasar.
Meringkaskan
Strategi bouncing moving average adalah strategi pelacakan tren yang sederhana dan praktis. Ini berjalan lancar, pengembalian kecil, dan mudah dipahami. Namun, ada risiko sinyal palsu dan risiko stop loss.
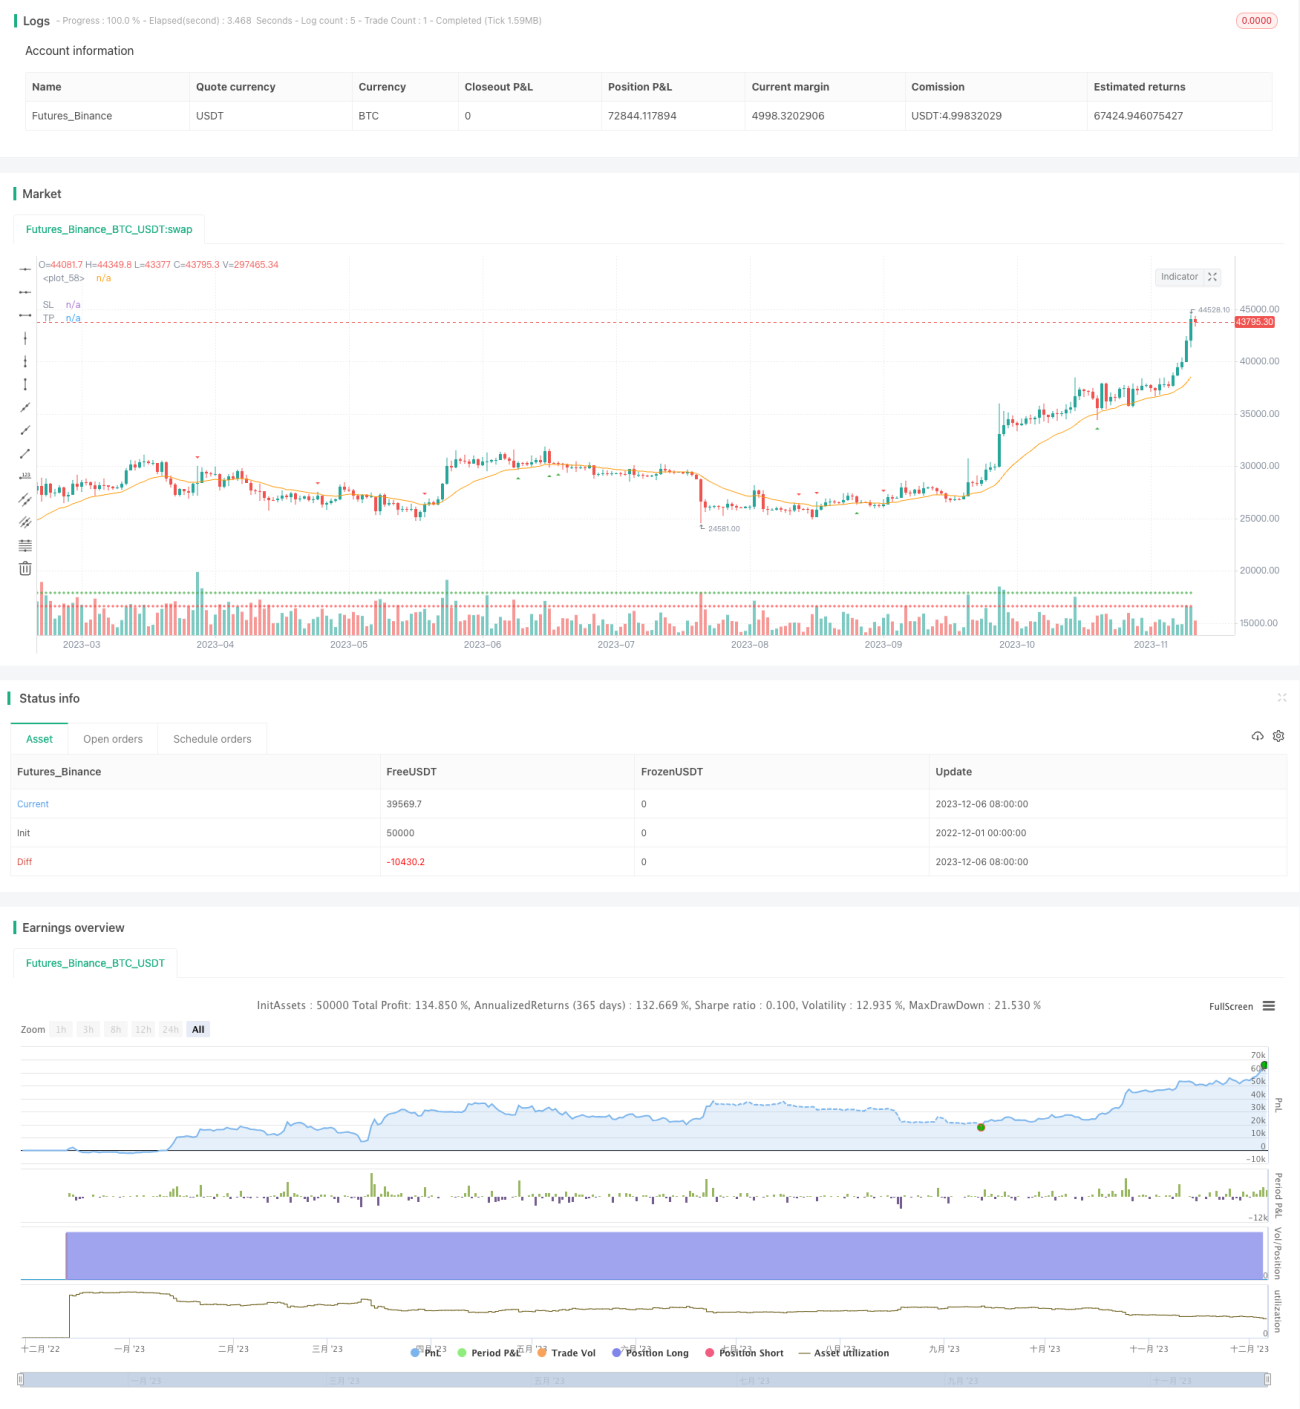
/*backtest
start: 2022-12-01 00:00:00
end: 2023-12-07 00:00:00
period: 1d
basePeriod: 1h
exchanges: [{"eid":"Futures_Binance","currency":"BTC_USDT"}]
*/

// This source code is subject to the terms of the Mozilla Public License 2.0 at https://mozilla.org/MPL/2.0/
// © tweakerID

// Simple strategy that checks for price bounces over an Exponential Moving Average. If the CLOSE of the candle bounces- 1