Strategi Mengikuti Tren Pembalikan Ganda

Ringkasan
Ini adalah strategi pelacakan tren yang menggabungkan sinyal reversal ganda. Ini mengintegrasikan strategi 123 reversal dan strategi indeks kinerja untuk melacak titik reversal harga dan membuat penilaian tren yang lebih andal.
Prinsip Strategi
Strategi ini terdiri dari dua substrategi:
-
123 Strategi Pembalasan
Dengan menggunakan 14 hari garis K untuk menilai sinyal pembalikan. Aturan spesifik adalah:
- Sinyal multi-head: dua hari sebelumnya harga close-out turun, saat ini K-line close-out lebih tinggi dari close-out hari sebelumnya, 9 hari Stochastic Slow di bawah 50
- Sinyal kosong: dua hari sebelumnya harga close-out naik, saat ini harga close-out K-line lebih rendah dari close-out hari sebelumnya, 9 hari Stochastic Fast lebih tinggi dari 50
-
Strategi Indeks Kinerja
Perhitungan kenaikan dan penurunan selama 14 hari terakhir sebagai indikator.
- Indeks kinerja> ((0)), menghasilkan sinyal multihead
- Indeks kinerja <(0), menghasilkan sinyal kosong
Sinyal akhir adalah kombinasi dari dua jenis sinyal. Sinyal multi-halus yang berarah ke arah yang sama diperlukan untuk menghasilkan operasi jual beli yang sebenarnya.
Ini akan memfilter sebagian dari kebisingan dan membuat sinyal lebih dapat diandalkan.
Keunggulan Strategis
Sistem dual-reverse ini memiliki beberapa keuntungan:
- Dengan kombinasi dua faktor penilaian, sinyal lebih dapat diandalkan.
- Ini akan membantu Anda menyaring kebisingan pasar dan menghindari sinyal palsu.
- 123 bentuk klasik dan praktis, mudah dinilai dan direproduksi
- Indeks kinerja dapat menentukan tren masa depan
- Kombinasi parameter fleksibel dan dapat dioptimalkan lebih lanjut
Risiko Strategis
Strategi ini juga memiliki beberapa risiko:
- Mungkin terlewatkan perubahan mendadak dan tidak dapat menangkap tren secara menyeluruh
- Kombinasi kondisi ganda menyebabkan sinyal menjadi kurang dan dapat mempengaruhi profitabilitas
- Perlu penilaian peer-to-peer, rentan terhadap fluktuasi khusus saham
- Masalah pengaturan parameter dapat menyebabkan sinyal menyimpang
Ada beberapa hal yang dapat dipertimbangkan untuk dioptimalkan:
- Mengatur parameter, seperti panjang K, siklus Stokastik, dan lain sebagainya
- Optimalkan logika penilaian sinyal ganda
- Tergabung dengan faktor-faktor lain, seperti volume transaksi dan sebagainya.
- Meningkatkan mekanisme penghentian kerugian
Meringkaskan
Strategi ini mengintegrasikan penilaian reversal ganda, yang dapat secara efektif menemukan titik-titik perubahan harga. Meskipun probabilitas sinyal terjadi lebih rendah, tetapi keandalan yang lebih tinggi, cocok untuk menangkap tren garis panjang tengah. Efektivitas strategi dapat ditingkatkan lebih lanjut melalui penyesuaian parameter dan optimasi multi-faktor.
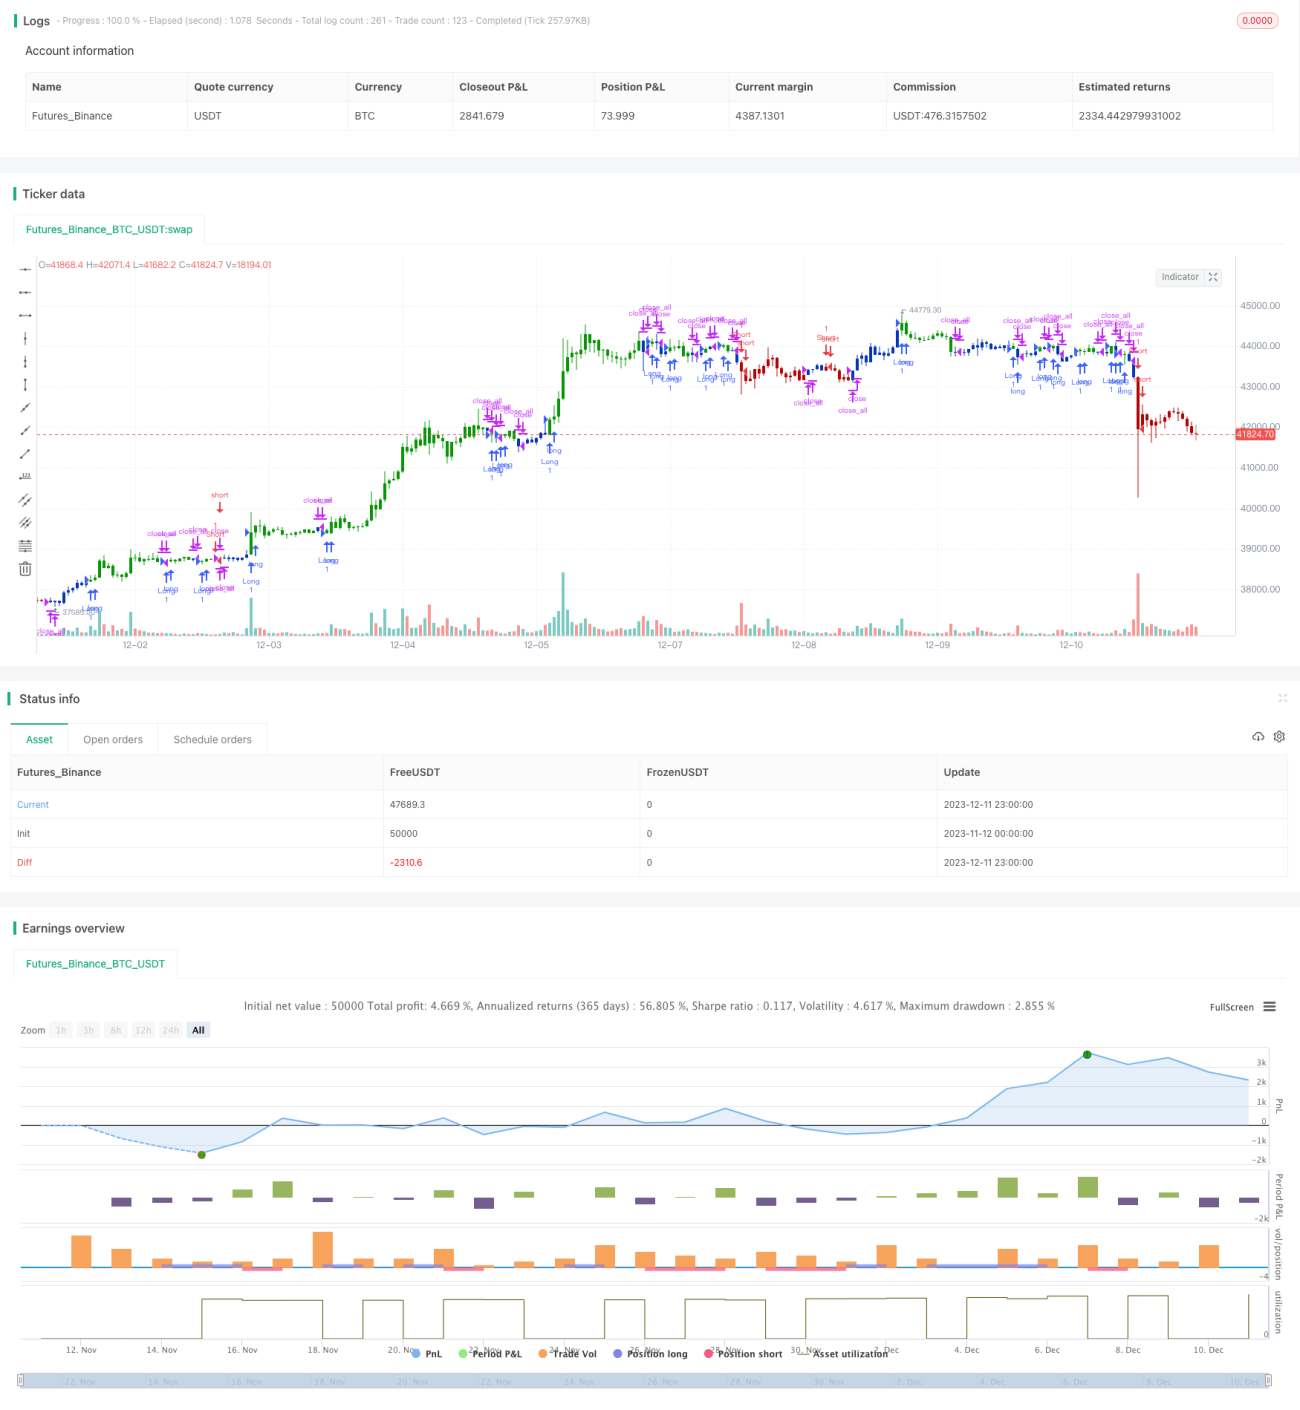
/*backtest
start: 2023-11-12 00:00:00
end: 2023-12-12 00:00:00
period: 1h
basePeriod: 15m
exchanges: [{"eid":"Futures_Binance","currency":"BTC_USDT"}]
*/

//@version=4
////////////////////////////////////////////////////////////
//  Copyright by HPotter v1.0 15/04/2021
// This is combo strategies for get a cumulative signal. - 1