Strategi pelacakan pembalikan kuantitatif faktor ganda

Ringkasan
Strategi ini menggabungkan 123 reversal dan super oscillator dua faktor, untuk mencapai dua faktor kuantitatif reversal pelacakan perdagangan. Ide dasarnya adalah untuk menilai reversal pasar sementara, digabungkan dengan super oscillator sinyal kosong, untuk mencapai lebih akurat Entry timing.
Strategi ini terutama berlaku untuk perdagangan reversal pada garis pendek dan menengah, dengan konfirmasi multi faktor, dapat secara efektif memfilter reversal palsu, meningkatkan kualitas sinyal.
Prinsip Strategi
-
123 bentuk terbalik
Berdasarkan ukuran hubungan antara harga penutupan dua hari sebelumnya dan harga penutupan saat ini, bentuk "tinggi-tinggi-rendah" atau "rendah-rendah-tinggi" menunjukkan kemungkinan adanya sinyal pembalikan.
Selain itu, Stochastic juga diminta berada di zona overbought dan oversold, untuk lebih mengkonfirmasi sinyal reversal, dan memfilter reversal palsu.
-
Awesome Oscillator (Indikator Oscillator Hebat)
Awesome Oscillator adalah indikator dinamis yang dibangun berdasarkan perbedaan antara rata-rata jangka pendek dan rata-rata jangka pendek. Ketika garis cepat melintasi garis lambat dari atas ke bawah, itu adalah titik jual; ketika melintasi dari bawah ke atas, itu adalah titik beli.
Strategi ini menggunakan indikator ini untuk menentukan posisi jual beli.
-
Konfirmasi Dua Faktor
Dengan 123 Reversal and Awesome Oscillator Double Confirmation, Anda dapat secara efektif memfilter Reversal Palsu dan meningkatkan akurasi Entry Timing.
Keunggulan Strategis
-
Dengan menggunakan faktor ganda untuk menentukan titik balik, dapat secara efektif memfilter sinyal balik palsu.
-
Awesome Oscillator sebagai indikator momentum, dapat meningkatkan akurasi Entry timing.
-
Dengan ditambahkannya indikator stochastic, risiko overclocking dan underclocking dapat dihindari.
-
Strategi pembalikan itu sendiri memiliki keuntungan yang lebih tinggi dari kemenangan dan kerugian.
Risiko Strategis
-
Risiko kegagalan reversal masih ada. Menggunakan faktor ganda dapat mengurangi probabilitas, tetapi tidak dapat sepenuhnya menghindari risiko tersebut.
-
Risiko overoptimisasi. Pengaturan parameter indikator memerlukan pengujian optimasi untuk pasar yang berbeda untuk mencegah overoptimisasi.
-
Risiko pasar berbalik. Dalam situasi yang kuat, strategi pembalikan mudah menghasilkan kerugian berbalik. Anda dapat mengatur stop loss untuk mengendalikan risiko.
Arah optimasi strategi
-
Tes mengoptimalkan kombinasi parameter indikator untuk meningkatkan robustitas parameter.
-
Meningkatkan strategi stop loss dan mengendalikan kerugian tunggal.
-
Bergabunglah dengan industri, sektor, dan pilihlah saham yang tidak tepat.
-
Optimalkan siklus kepemilikan untuk mencegah penelusuran yang terlalu membabi buta
-
Uji coba sistem linear yang berbeda sebagai kondisi tambahan.
Meringkaskan
Kesimpulannya, strategi pelacakan reversal kuantitatif dua faktor ini, dengan menggunakan Awesome Oscillator sebagai alat bantu entry timing, dan menghindari penarikan dengan indikator Stochastic, dapat secara efektif mengendalikan risiko perdagangan reversal, dengan dasar jaminan probabilitas keuntungan dan rasio untung rugi tertentu.
Namun, risiko dari strategi reversal itu sendiri tidak dapat diabaikan, masih perlu mengoptimalkan parameter indikator, mengatur kondisi stop loss, dan lain-lain untuk mengendalikan risiko. Jika digunakan dengan benar, strategi ini dapat menghasilkan keuntungan ekstra yang stabil bagi investor.
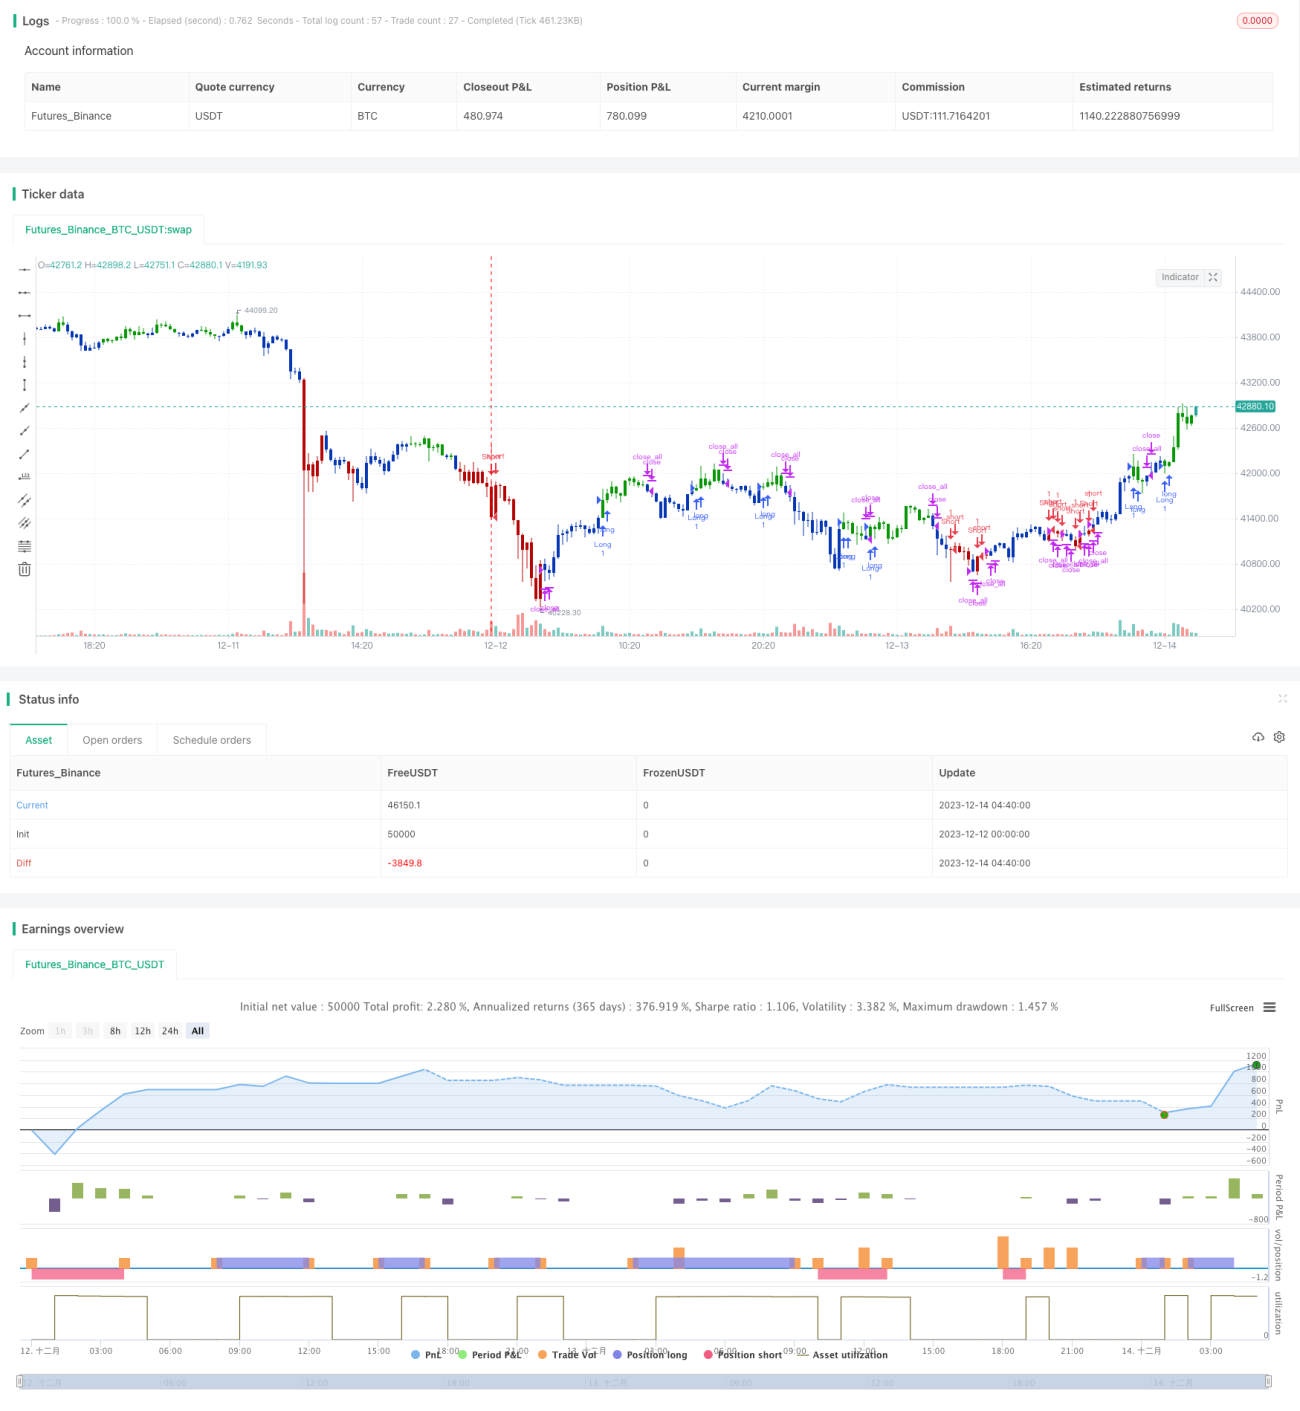
/*backtest
start: 2023-12-12 00:00:00
end: 2023-12-14 05:00:00
period: 20m
basePeriod: 1m
exchanges: [{"eid":"Futures_Binance","currency":"BTC_USDT"}]
*/

//@version=4
////////////////////////////////////////////////////////////
//  Copyright by HPotter v1.0 12/08/2021
// This is combo strategies for get a cumulative signal. - 1