Strategi pengujian ulang volatilitas statistik berdasarkan metode nilai ekstrem
Ringkasan
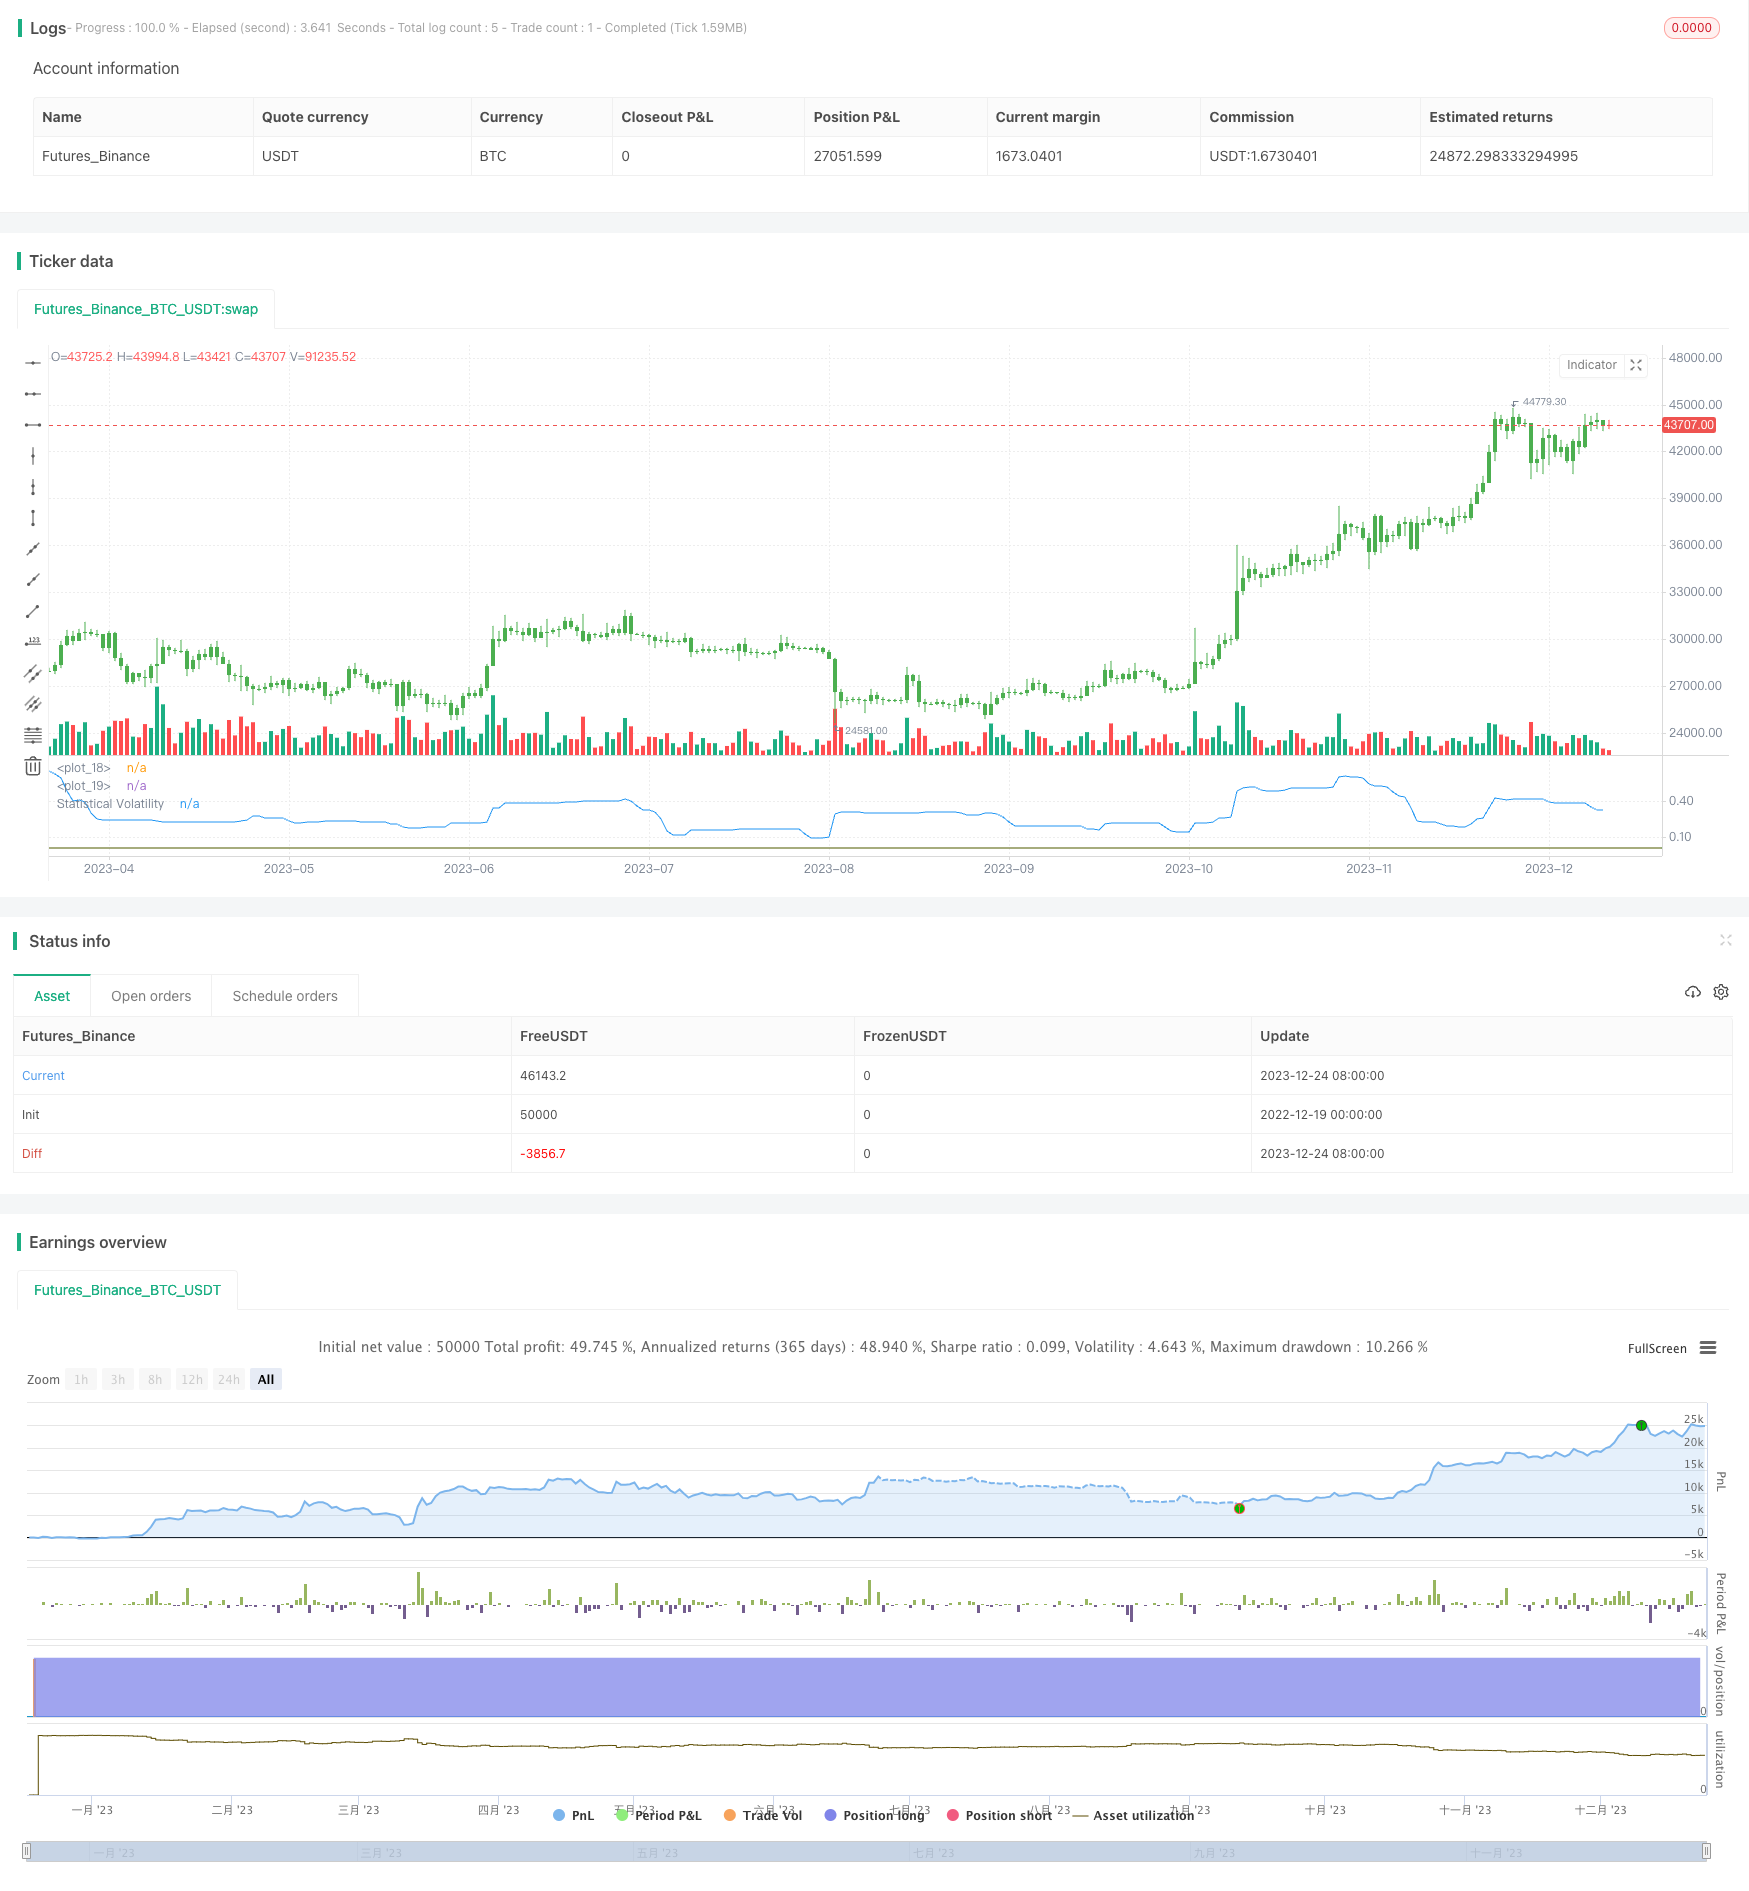
Strategi ini menggunakan metode volatilitas statistik untuk menghitung volatilitas statistik, juga dikenal sebagai volatilitas historis. Ini didasarkan pada nilai tertinggi, harga terendah, harga penutupan, dan faktor waktu untuk menghitung volatilitas statistik.
Prinsip Strategi
Perhitungan harga tertinggi, harga terendah, dan harga penutupan dalam periode waktu tertentu
Menggunakan rumus nilai ekstrim untuk menghitung volatilitas statistik
SqrTime = sqrt(253 / Length)
Vol = ((0.6 * log(xMaxC / xMinC) * SqrTime) + (0.6 * log(xMaxH / xMinL) * SqrTime)) * 0.5
Bandingkan volatilitas dengan set up and down threshold, menghasilkan sinyal perdagangan
pos = iff(nRes > TopBand, 1,
         iff(nRes < LowBand, -1, nz(pos[1], 0)))
Melakukan over atau under berdasarkan sinyal trading
Analisis Keunggulan
Strategi ini memiliki beberapa keuntungan:
- Menggunakan indikator volatilitas statistik, dapat secara efektif menangkap titik panas dan peluang reversal di pasar
- Metode nilai ekstrim untuk menghitung volatilitas, tidak sensitif terhadap harga ekstrim, hasilnya lebih stabil dan dapat diandalkan
- Trading dapat disesuaikan dengan berbagai lingkungan volatilitas dengan menyesuaikan parameter
Analisis risiko
Strategi ini memiliki risiko utama sebagai berikut:
- Volatilitas statistik sendiri memiliki keterlambatan tertentu, tidak dapat dengan tepat menangkap titik balik pasar
- Indeks volatilitas lambat bereaksi terhadap kejadian yang tidak terduga, kemungkinan kehilangan peluang perdagangan jangka pendek
- Ada beberapa risiko perdagangan yang salah dan risiko stop loss
Cara Mengatasi dan Mengatasi:
- Mempersingkat siklus statistik dan meningkatkan sensitivitas terhadap perubahan pasar
- Tergabung dengan indikator lain sebagai tambahan untuk meningkatkan akurasi sinyal
- Tetapkan Stop Loss, Kendalikan Kerugian Tunggal
Arah optimasi
Strategi ini akan dioptimalkan untuk:
- Uji berbagai parameter siklus statistik untuk menemukan parameter optimal
- Menambahkan modul manajemen posisi untuk menyesuaikan posisi berdasarkan volatilitas
- Menggabungkan indikator seperti moving averages, mengatur kondisi penyaringan, mengurangi kesalahan transaksi
Meringkaskan
Strategi ini menggunakan metode nilai ekstrim untuk menghitung volatilitas statistik dan menghasilkan sinyal perdagangan dengan menangkap fluktuasi volatilitas. Dibandingkan dengan indikator seperti rata-rata bergerak sederhana, ini lebih dapat mencerminkan volatilitas pasar dan menangkap reversal. Pada saat yang sama, algoritma nilai ekstrim juga membuat hasilnya lebih stabil dan dapat diandalkan.
/*backtest
start: 2022-12-19 00:00:00
end: 2023-12-25 00:00:00
period: 1d
basePeriod: 1h
exchanges: [{"eid":"Futures_Binance","currency":"BTC_USDT"}]
*/

//@version=2
////////////////////////////////////////////////////////////
//  Copyright by HPotter v1.0 22/11/2014
// This indicator used to calculate the statistical volatility, sometime
// called historical volatility, based on the Extreme Value Method.
// Please use this link to get more information about Volatility.
//
// You can change long to short in the Input Settings
// WARNING:
// - For purpose educate only
// - This script to change bars colors.
////////////////////////////////////////////////////////////
strategy(title="Statistical Volatility - Extreme Value Method ", shorttitle="Statistical Volatility Backtest")
Length = input(30, minval=1)
TopBand = input(0.005, step=0.001)
LowBand = input(0.0016, step=0.001)
reverse = input(false, title="Trade reverse")
hline(TopBand, color=red, linestyle=line)
hline(LowBand, color=green, linestyle=line)
xMaxC = highest(close, Length)
xMaxH = highest(high, Length)
xMinC = lowest(close, Length)
xMinL = lowest(low, Length)
SqrTime = sqrt(253 / Length)
Vol = ((0.6 * log(xMaxC / xMinC) * SqrTime) + (0.6 * log(xMaxH / xMinL) * SqrTime)) * 0.5
nRes = iff(Vol < 0,  0, iff(Vol > 2.99, 2.99, Vol))
pos = iff(nRes > TopBand, 1,
	   iff(nRes < LowBand, -1, nz(pos[1], 0)))
possig = iff(reverse and pos == 1, -1,
          iff(reverse and pos == -1, 1, pos))
if (possig == 1)
    strategy.entry("Long", strategy.long)
if (possig == -1)
    strategy.entry("Short", strategy.short)
barcolor(possig == -1 ? red: possig == 1 ? green : blue )
plot(nRes, color=blue, title="Statistical Volatility")