Strategi Perdagangan Kuantitatif Kotak Getaran
Ringkasan
Strategi perdagangan kuantitatif bergoyang adalah strategi perdagangan garis pendek yang menggunakan saluran kotak Darvas untuk menangkap tren pasar. Strategi ini terutama bergantung pada indikator bergoyang untuk menilai pergerakan pasar dan mencari peluang perdagangan.
Prinsip Strategi
- Dengan menggunakan parameter length, setel panjang kotak goyang.
- Perhatikan tren berdasarkan titik tinggi dan titik rendah, dan lakukan lebih banyak posisi kosong.
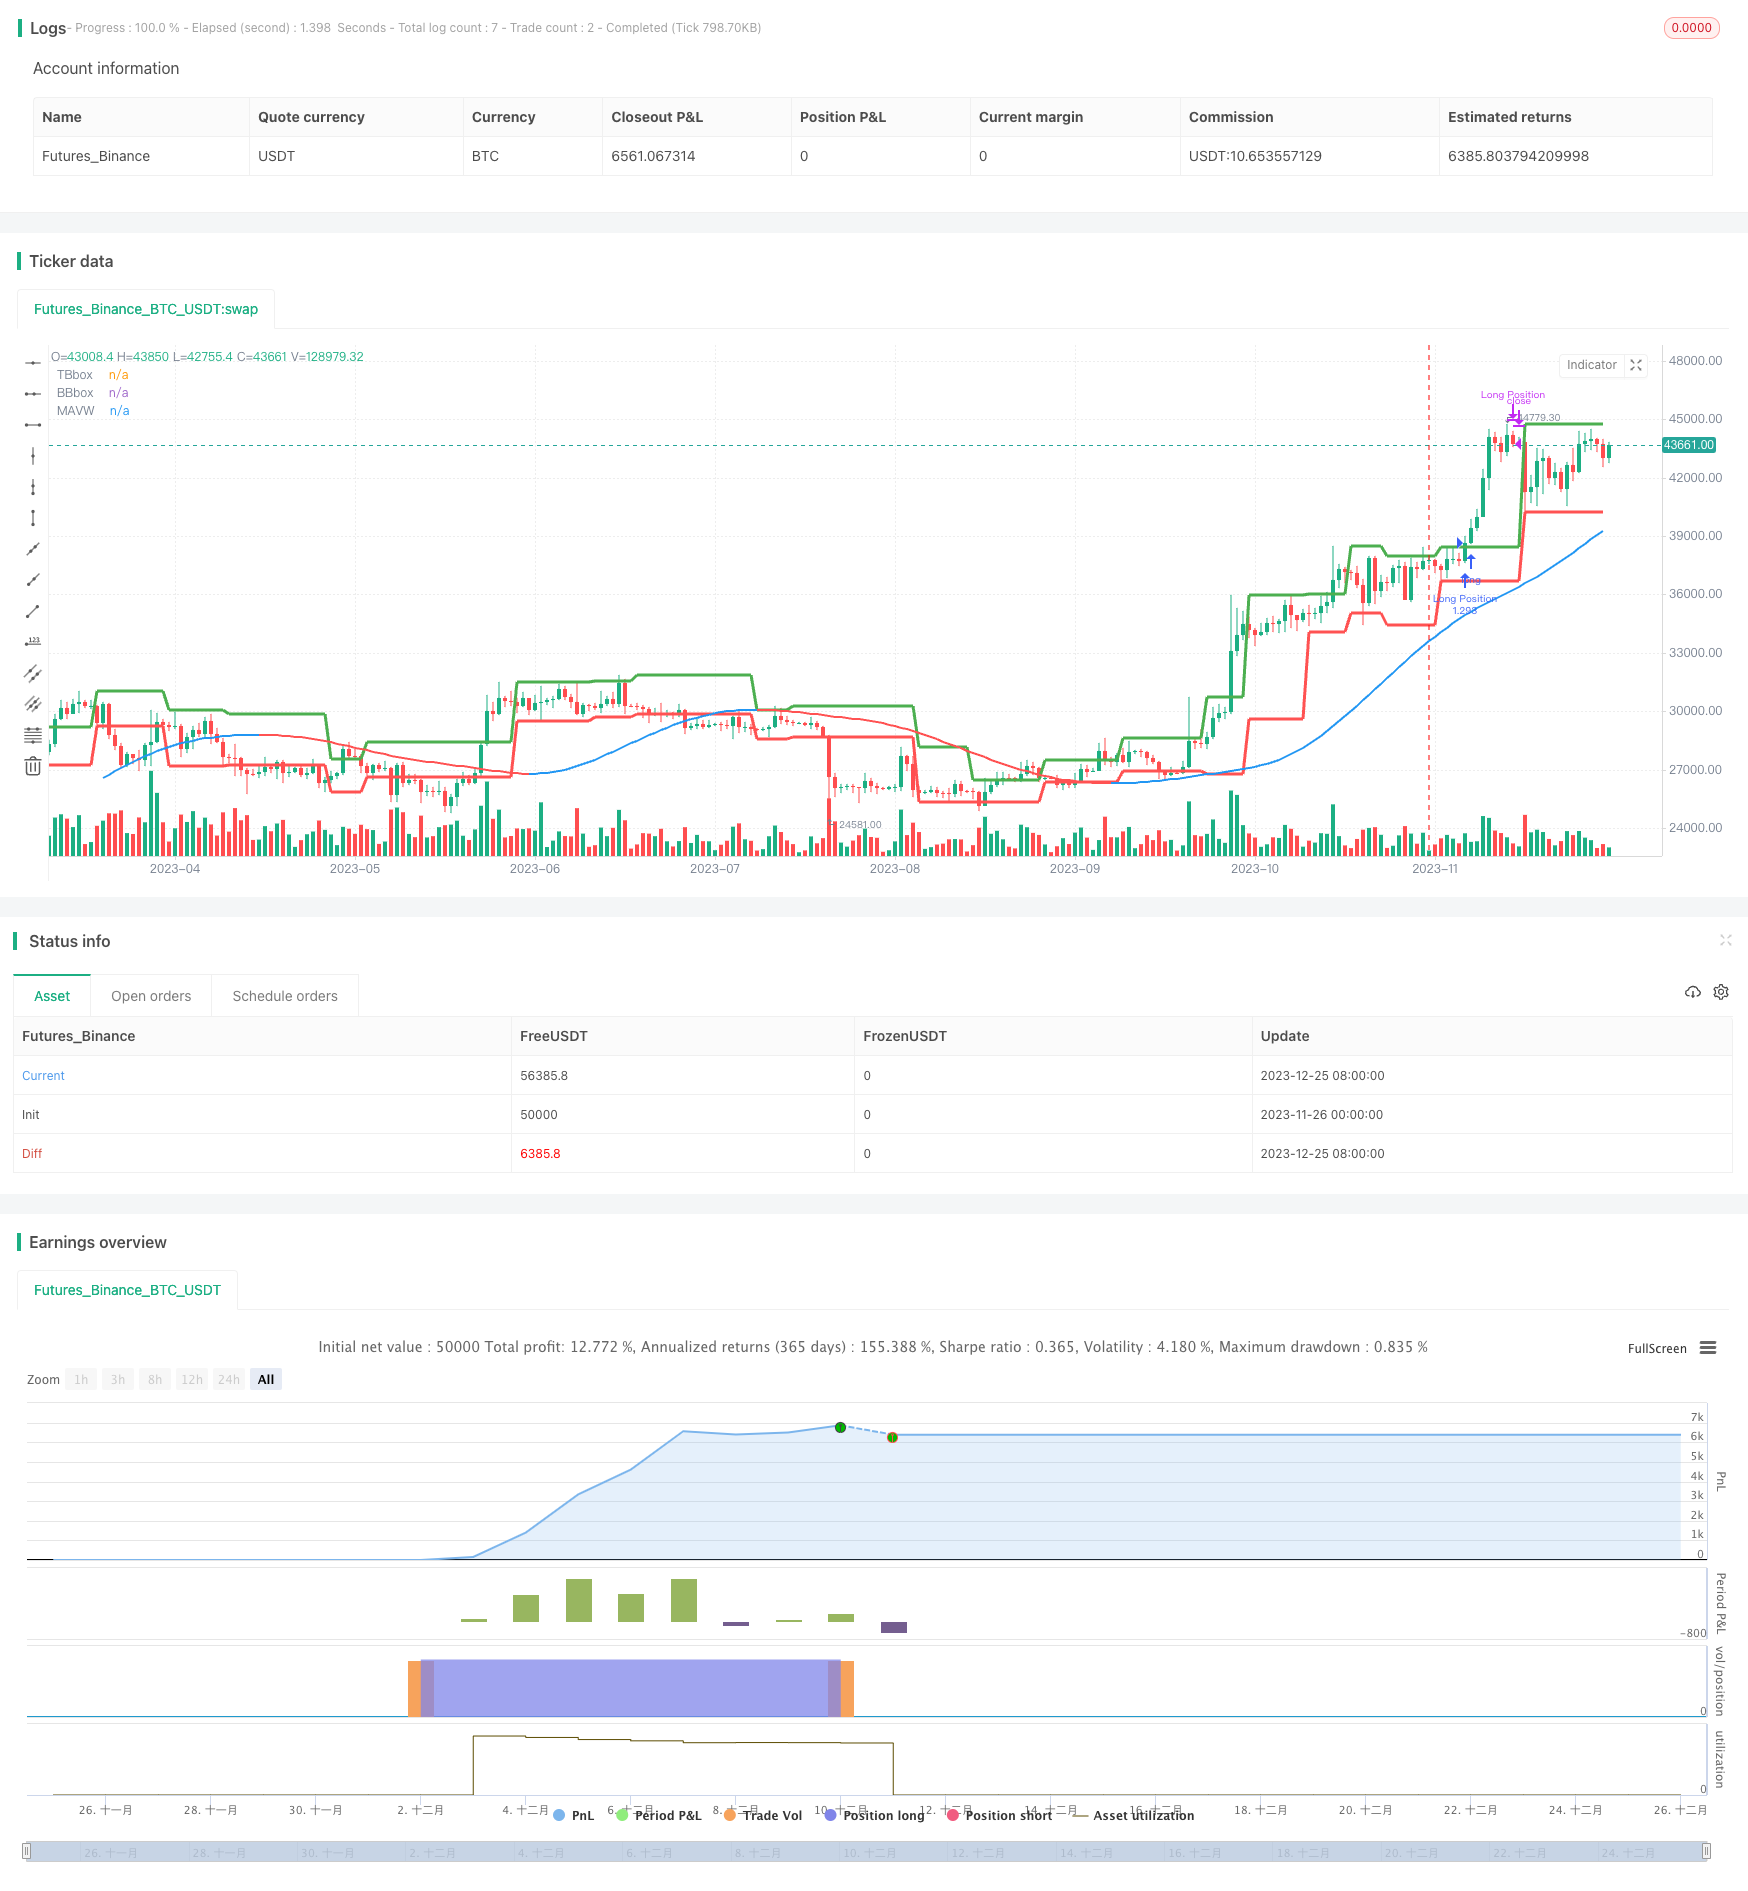
- Ketika harga menembus kotak hadiah, garis TopBox berwarna hijau akan muncul di grafik. Ini adalah sinyal melakukan lebih banyak.
- Ketika harga turun di bawah kotak harta, garis BottomBox merah akan ditampilkan pada grafik.
- Menggunakan sistem multi rata-rata garis sebagai indikator penilaian tambahan. Ketika harga lebih tinggi dari rata-rata garis ganda dan lebih rendah dari rata-rata garis kosong.
- Menggunakan indikator RVI untuk menentukan area overbought dan oversold. Jika RVI lebih tinggi dari garis Signal, itu adalah sinyal overbought. Jika RVI lebih rendah dari garis Signal, itu adalah sinyal kosong.
Setelah penilaian gabungan dari beberapa indikator di atas, masuk. Stop loss adalah sisi lain dari kotak hadiah. Stop EXIT menggunakan arah RVI untuk menutup pesanan.
Analisis Keunggulan
- Menggunakan saluran Treasure Box untuk menilai arah tren pasar, menghindari kesempatan untuk melewatkan tren besar.
- Saluran kotak-kotak ini mudah terbentuk dan memiliki frekuensi sinyal yang tinggi.
- Pengaturan Stop Loss Treasure Box cukup masuk akal, sehingga dapat mengontrol Stop Loss secara baik.
- Multivariate Average and RVI Assisted Judgment dapat meningkatkan akurasi pengambilan keputusan.
Analisis risiko
- Stop loss dari kotak bergetar lebih luas, dan risiko kerugian lebih besar.
- Ada beberapa hal yang perlu diperhatikan dalam trading forex, yaitu:
- Cara pembentukan saluran kotak harta tidak selalu benar, ada sinyal yang salah.
- Parameter perlu disesuaikan agar indikator tambahan sesuai dengan kotak.
Risiko dapat dikurangi dengan pengetatan stop loss yang tepat. Selain itu, parameter indikator bantu juga perlu disesuaikan untuk tes agar dapat berfungsi sebagai penyaringan terbaik.
Arah optimasi
- Uji parameter kotak dengan panjang yang berbeda untuk menemukan panjang yang optimal.
- Optimalkan parameter indikator tambahan agar sesuai dengan kotak hadiah.
- Cobalah indikator tambahan lainnya untuk memverifikasi sinyal lebih lanjut, seperti KDJ, MACD, dll.
- Tes kondisi stop loss dan stop loss untuk membuat strategi lebih stabil.
Meringkaskan
Strategi perdagangan kuantitatif kotak harta gemetar secara keseluruhan adalah strategi perdagangan garis pendek yang lebih aktif. Ini dapat menangkap perubahan tren pasar secara tepat waktu, memanfaatkan saluran kotak harta untuk membuka posisi; dan kombinasi dengan indikator tambahan dapat meningkatkan akurasi keputusan.
/*backtest
start: 2023-11-26 00:00:00
end: 2023-12-26 00:00:00
period: 1d
basePeriod: 1h
exchanges: [{"eid":"Futures_Binance","currency":"BTC_USDT"}]
*/

// This source code is subject to the terms of the Mozilla Public License 2.0 at https://mozilla.org/MPL/2.0/
// © xxy_theone
// https://www.youtube.com/watch?v=YYxlnFOX9sQ
// This strategy script has been made to backtest the strategy explained in the video above


//@version=5
strategy(shorttitle = "Darvas Box Test", title="TradeIQ Darvas Box Test", overlay=true, pyramiding=0, default_qty_type=strategy.percent_of_equity, default_qty_value=100, initial_capital=100, currency=currency.USD)

// === INPUT BACKTEST RANGE ===
var GRP1 = "Backtest Range"
fromDate = input(timestamp("7 Mar 2022 00:00 +0000"), "From", group=GRP1)
toDate = input(timestamp("19 Mar 2022 23:59 +0000"), "To", group=GRP1)
window() =>  true


var GRP3 = "Darvas Box"
boxp=input(5, "Box Length", group=GRP3)

LL = ta.lowest(low,boxp)
k1=ta.highest(high,boxp)
k2=ta.highest(high,boxp-1)
k3=ta.highest(high,boxp-2)

NH =  ta.valuewhen(high>k1[1],high,0)
box1 =k3<k2
TopBox = ta.valuewhen(ta.barssince(high>k1[1])==boxp-2 and box1, NH, 0)
BottomBox = ta.valuewhen(ta.barssince(high>k1[1])==boxp-2 and box1, LL, 0)


plot(TopBox, linewidth=3, color=color.green, title="TBbox")
plot(BottomBox, linewidth=3, color=color.red, title="BBbox")


var GRP4 = "MavilimW"

fmal=input(3,"First Moving Average length", group=GRP4)
smal=input(5,"Second Moving Average length", group=GRP4)
tmal=fmal+smal
Fmal=smal+tmal
Ftmal=tmal+Fmal
Smal=Fmal+Ftmal

M1= ta.wma(close, fmal)
M2= ta.wma(M1, smal)
M3= ta.wma(M2, tmal)
M4= ta.wma(M3, Fmal)
M5= ta.wma(M4, Ftmal)
MAVW= ta.wma(M5, Smal)
col1= MAVW>MAVW[1]
col3= MAVW<MAVW[1]
colorM = col1 ? color.blue : col3 ? color.red : color.yellow

plot(MAVW, color=colorM, linewidth=2, title="MAVW")


var GRP5 = "Relative Vigor Index"
len = input.int(10, title="Length", minval=1, group=GRP5)
rvi = math.sum(ta.swma(close-open), len)/math.sum(ta.swma(high-low),len)
sig = ta.swma(rvi)
offset = input.int(0, "Offset", minval = -500, maxval = 500, group=GRP5)
//plot(rvi, color=#008000, title="RVGI", offset = offset)
//plot(sig, color=#FF0000, title="Signal", offset = offset)


var longStopSet = false

long = ta.crossover(close,TopBox) and close > MAVW ? true : false
longClose = strategy.opentrades.profit(strategy.opentrades-1)>0 and ta.crossunder(rvi,sig) ? true : false
strategy.entry("Long Position", strategy.long, when = long and window() and strategy.position_size==0 and strategy.closedtrades<100)
if(longStopSet==false and strategy.position_size > 0)
    strategy.exit("exit", "Long Position", stop=BottomBox)
    longStopSet := true
if(strategy.position_size==0)
    longStopSet := false
strategy.close("Long Position", when = longClose)

var shortStopSet = false

short = ta.crossunder(close,BottomBox) and close < MAVW ? true : false
shortClose = strategy.opentrades.profit(strategy.opentrades-1)>0 and ta.crossover(rvi,sig) ? true : false
strategy.entry("Short Position", strategy.short, when = short and window() and strategy.position_size==0 and strategy.closedtrades<100)
if(shortStopSet==false and strategy.position_size < 0)
    strategy.exit("exit", "Short Position", stop=TopBox)
    shortStopSet := true
if(strategy.position_size==0)
    shortStopSet := false
strategy.close("Short Position", when = shortClose)