Strategi Tren Momentum ADX

Ikhtisar
Strategi ini menggunakan indikator ADX untuk menilai tren pasar, dikombinasikan dengan indikator DMI untuk menentukan arah bullish/bearish, memanfaatkan kemiringan ADX untuk mengukur kekuatan tren, menetapkan nilai kunci ADX untuk menyaring pasar non-tren, dan dibantu oleh moving average untuk menyaring sinyal trading.
Prinsip Strategi
- Hitung indikator ADX, DI+, dan DI-.
- Kemiringan ADX > 0 menunjukkan tren meningkat; nilai kunci ditetapkan sebesar 23 untuk menyaring pasar non-tren.
- DI+ lebih tinggi dari DI- menunjukkan kekuatan bullish lebih besar daripada bearish, merupakan sinyal bullish.
- Saat filter moving average diaktifkan, sinyal bullish hanya dihasilkan jika harga penutupan berada di atas moving average.
- Tutup posisi saat kemiringan ADX < 0, yang menunjukkan tren mulai memudar.
Analisis Keunggulan
- Dibantu oleh filter MA, dapat mengurangi noise trading di pasar non-tren.
- Kemiringan ADX mengukur kekuatan, memungkinkan penilaian yang akurat terhadap perkembangan tren.
- DI menentukan arah, dikombinasikan dengan ADX yang mengukur kekuatan, membentuk sistem pengambilan keputusan tren yang lengkap.
- Potensi drawdown dan rasio risk-reward diperkirakan lebih baik dibandingkan strategi moving average sederhana.
Analisis Risiko
- Parameter ADX yang berbeda akan menghasilkan hasil yang sangat bervariasi.
- Sebelum DMI sepenuhnya mengonfirmasi arah bullish/bearish, dapat menghasilkan sinyal yang salah.
- Terdapat keterlambatan tertentu yang mengurangi efisiensi strategi.
Arah Optimasi
- Optimasi kombinasi parameter ADX untuk menemukan parameter terbaik.
- Menambahkan strategi stop loss untuk menghindari kerugian per posisi yang membesar.
- Coba menggabungkan indikator lain untuk menyaring sinyal, misalnya RSI, Bollinger Bands.
Ringkasan
Strategi ini sepenuhnya memanfaatkan keunggulan ADX dalam menilai tren dan kekuatan tren, dikombinasikan dengan indikator DMI untuk menentukan arah, membentuk sistem pelacakan tren yang lengkap. Selain itu, moving average membantu menyaring noise di pasar non-tren secara efektif. Optimasi parameter dan kombinasi indikator dapat lebih meningkatkan stabilitas dan efisiensi strategi. Secara keseluruhan, strategi yang menggabungkan penilaian tren dan penentuan arah ini diharapkan dapat memberikan imbal hasil yang baik.
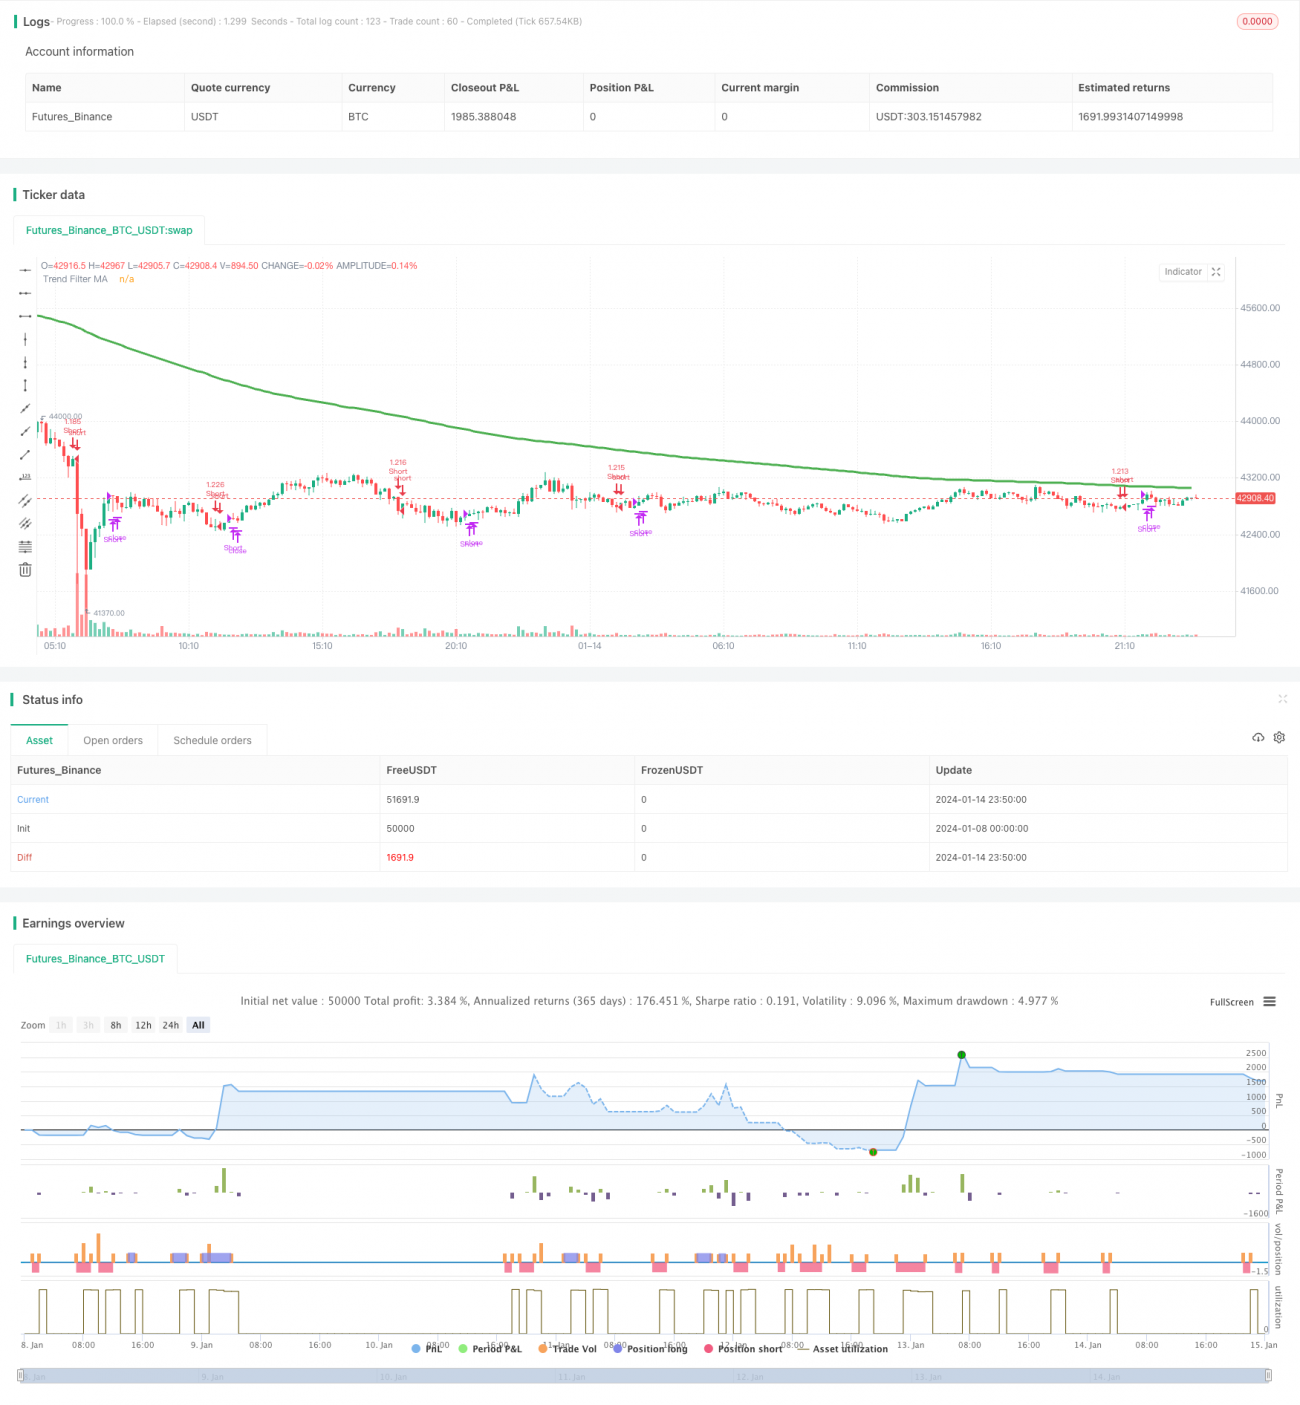
/*backtest
start: 2024-01-08 00:00:00
end: 2024-01-15 00:00:00
period: 10m
basePeriod: 1m
exchanges: [{"eid":"Futures_Binance","currency":"BTC_USDT"}]
*/

//@version=4
// This source code is subject to the terms of the Mozilla Public License 2.0 at https://mozilla.org/MPL/2.0/
// © millerrh with inspiration from @9e52f12edd034d28bdd5544e7ff92e
//The intent behind this study is to look at ADX when it has an increasing slope and is above a user-defined key level (23 default). - 1