Strategi Stop Loss Mengikuti Tren RSI
Ringkasan
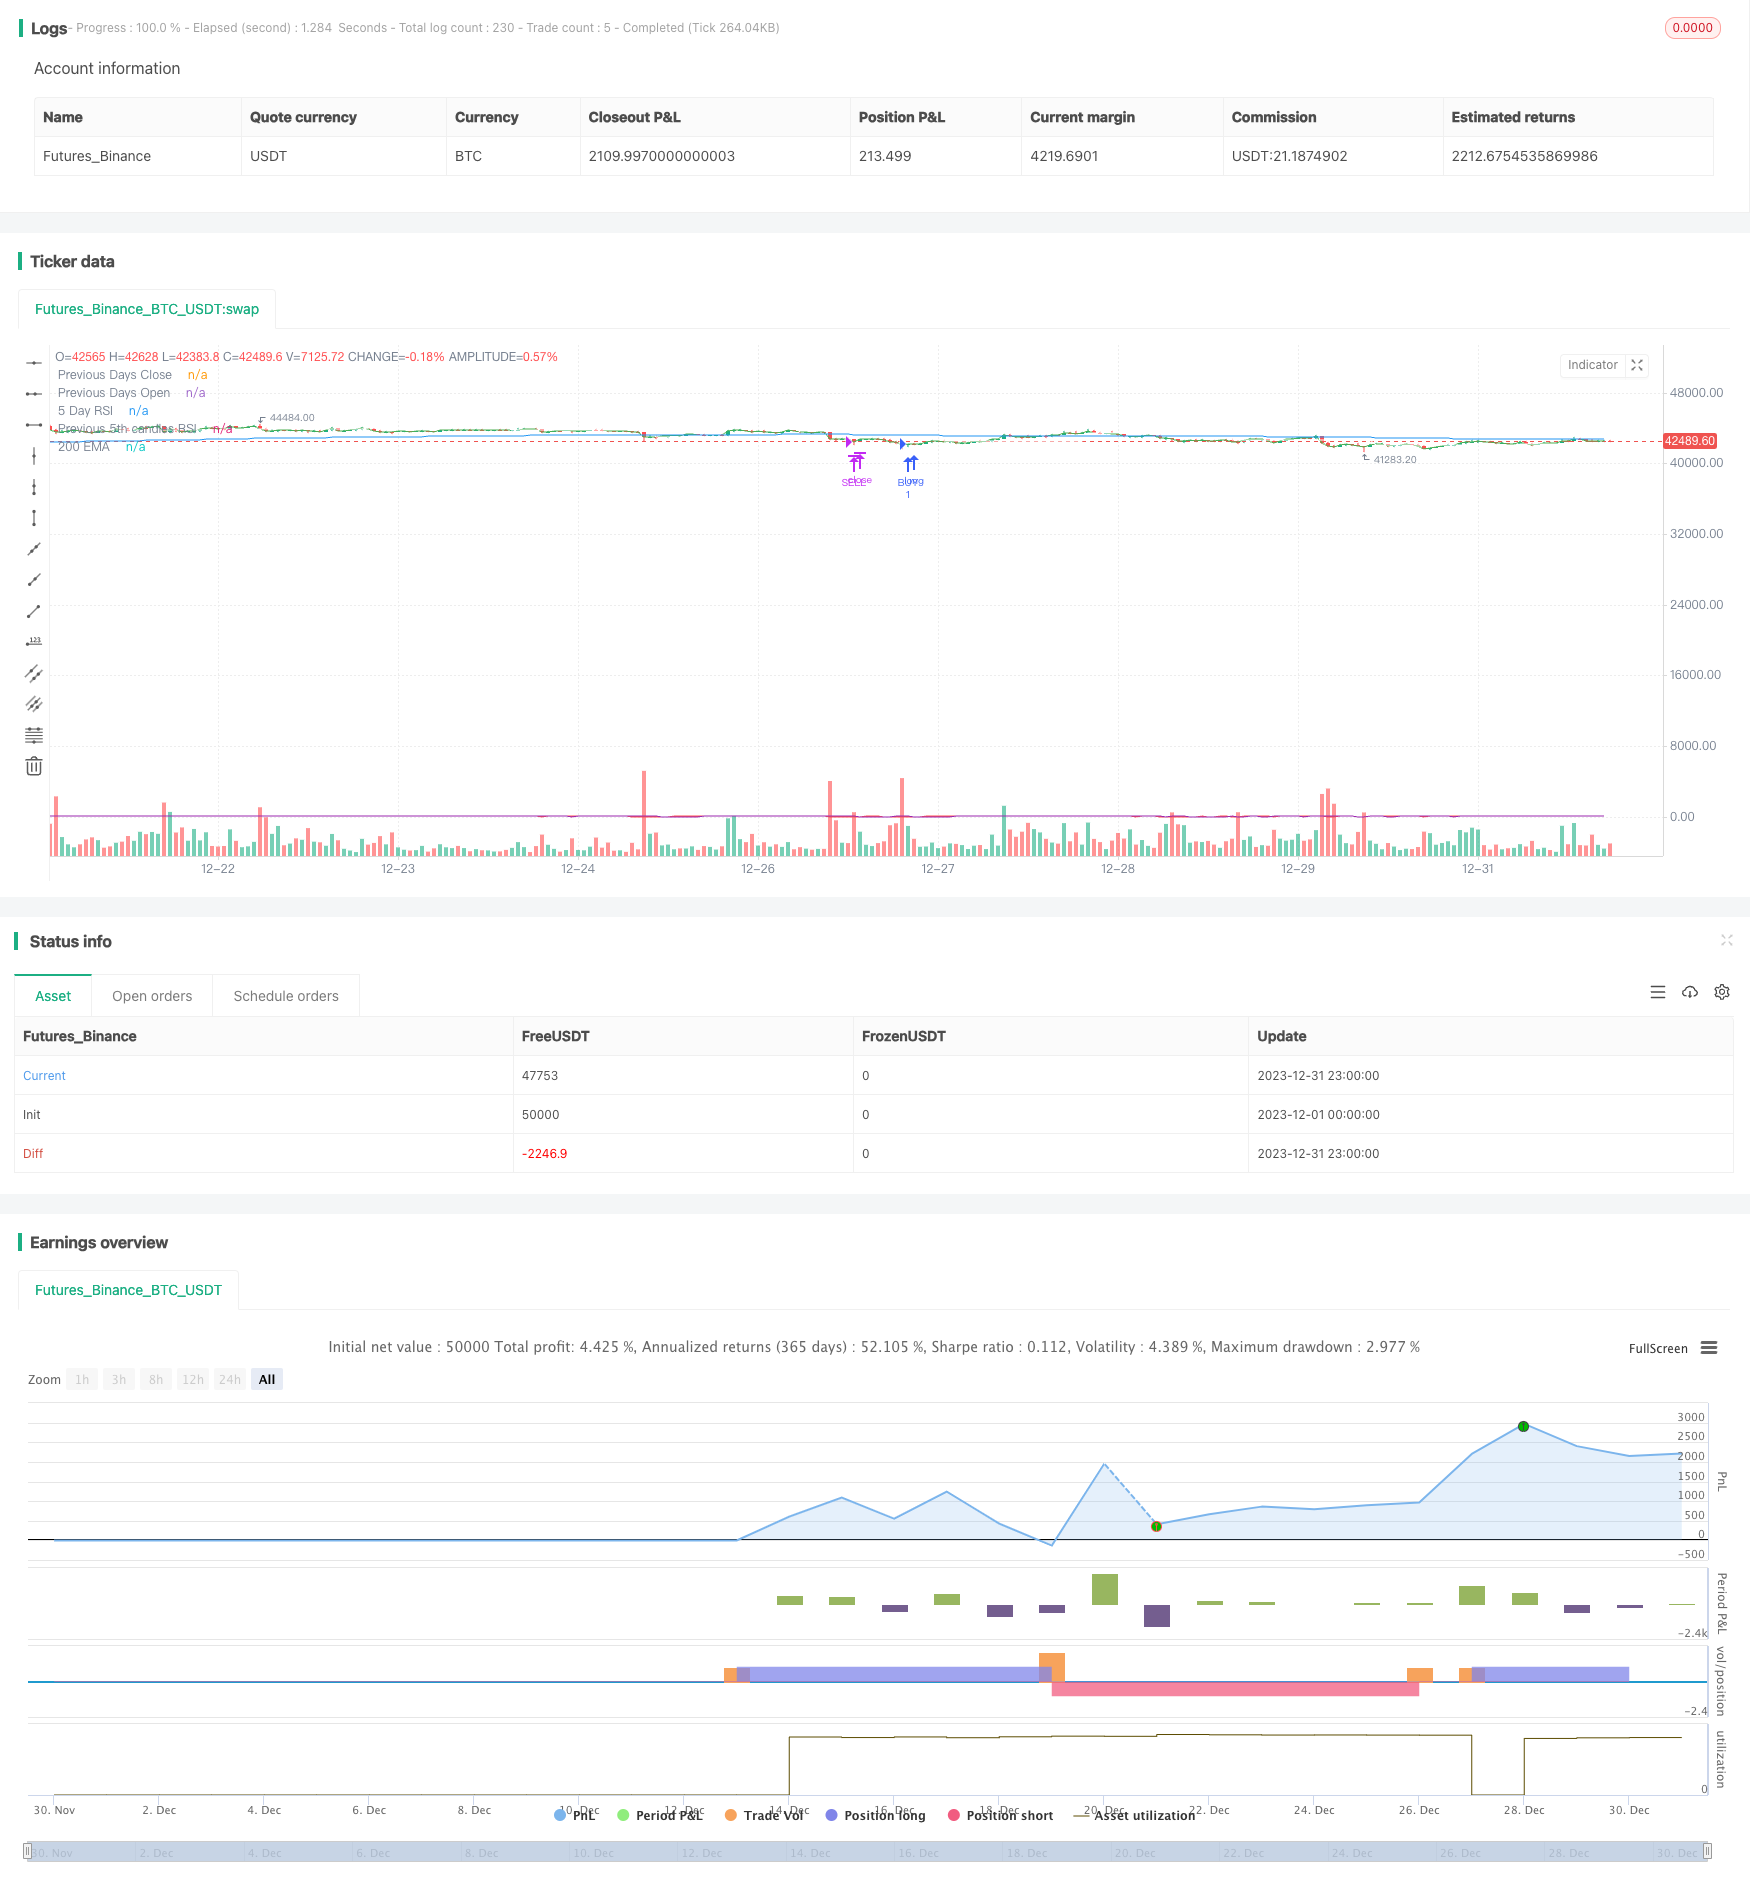
Ini adalah strategi perdagangan kuantitatif yang menggunakan indikator RSI untuk menentukan tren dan mengatur stop loss. Strategi ini dikombinasikan dengan indikator RSI untuk menentukan arah tren pasar, dan pengaturan stop loss dinamis untuk mengunci keuntungan, untuk meminimalkan risiko.
Prinsip Strategi
Strategi ini terutama menggunakan indikator RSI untuk menentukan arah tren pasar untuk memutuskan untuk melakukan shorting lebih banyak. Ketika indikator RSI melewati garis rendah, pasar berada dalam tren naik, melakukan shorting lebih banyak; Ketika indikator RSI melewati garis tinggi, pasar berada dalam tren menurun, melakukan shorting.
Strategi ini juga mengatur stop loss floating dengan melacak harga pembukaan setiap opsi. Untuk opsi ganda, setel harga pembukaan sebagai stop loss line, dan untuk opsi kosong setel harga pembukaan sebagai stop loss line. Strategi ini akan secara otomatis melakukan stop loss atau stop loss ketika harga menyentuh stop loss line.
Keunggulan Strategis
- Menggunakan indikator RSI untuk menentukan arah tren pasar, menghindari perdagangan di zona pelengkap;
- Pengaturan stop loss floating, yang memungkinkan untuk mengunci keuntungan secara fleksibel dan mengontrol risiko secara efektif;
- Parameter RSI dan Stop Loss Ratio dapat disesuaikan dan dioptimalkan melalui input eksternal.
Risiko Strategis
- Indeks RSI terbelakang dan mungkin melewatkan titik pergeseran tren jangka pendek;
- Stop Loss Barrier yang terlalu dekat bisa saja dirobek.
Arah optimasi
- RSI dapat diuji dalam berbagai periode;
- Kombinasi parameter yang berbeda dapat diuji untuk menemukan rasio stop loss yang optimal.
- Tanda-tanda tambahan dapat ditambahkan untuk menilai sinyal filter.
Meringkaskan
Strategi ini secara keseluruhan adalah strategi perdagangan kuantitatif yang menggunakan indikator RSI untuk melacak tren dan dilengkapi dengan stop loss floating. Strategi ini lebih baik dalam mengendalikan risiko dan dapat secara efektif mengunci keuntungan dibandingkan dengan strategi perdagangan indikator tunggal.
/*backtest
start: 2023-12-01 00:00:00
end: 2023-12-31 23:59:59
period: 1h
basePeriod: 15m
exchanges: [{"eid":"Futures_Binance","currency":"BTC_USDT"}]
*/

// This source code is subject to the terms of the Mozilla Public License 2.0 at https://mozilla.org/MPL/2.0/
// ©chewyScripts.

//@version=5
strategy("96er RSI+200EMA Strategy + Alerts", overlay=true, shorttitle = "The old 96er - RSI5 + 200 EMA")
//,use_bar_magnifier=false
// This works best on a small account $100, with 50% of equity and up to 10 max open trades.
// 96% Profitable, turns $100 into $350 in 1 month. very few losses. super happy with it.
// So far it triples the account on a 1m chart in 1 month back testing on the SEI-USD pair.
// I did not test on FX pairs or other instruments.
// had some issues with the inputs not working so had to hard code some, also the lastClose var sometimes breaks and starts following every candle, not sure why.

in_r1 = input.int(8,"5 day input or RSI1", group = "Signals")
in_lowerRSI = input.int(28,"RSI Lower", group = "Signals")
in_upperRSI = input.int(72,"RSI Upper ", group = "Signals")
in_emaperiod = input.int(200,"EMA Period", group = "Signals")
in_daysback = input.int(1,"Look back days for close/open", group = "Signals")

in_openOrders = input.int(5,"max open orders",tooltip = "Be careful, to high and you will get margin called!! 5 is probably the highest you should go", group = "Order Controls")
in_buybreakout = input.int(40,"Buy breakout range", group = "Order Controls")

in_buyTP = input.float(1.1500,"Buy TP: 1+TP %, .05 seems to work well.", group = "TPSL")
in_sellTP = input.float(0.9750, "Sell TP: 1-TP%. .025 seems to work well. ", group = "TPSL")

in_useAlerts = input.bool(false,"Turns on Buy/Sell Alerts",group = "Alerts")
in_useCustomAlertMSG = input.bool(false,"Use default Buy/Sell or the messages below",group = "Alerts")
in_alertBuySignalTxt = input("Buy","Buy signal API/TXT message template", tooltip = "Review the UserGuid on JSON varibles in alerts", group = "Alerts")
in_alertSellSignalTxt = input("Sell","Sell signal API/TXT message template", tooltip = "Review the UserGuid on JSON varibles in alerts", group = "Alerts")

simple int rsi5 = in_r1

// 3 rsi strategy , when all of them are overbought we sell, and vice versa
rsi7 = ta.rsi(close,rsi5)
[lastOpen, lastClose] = request.security(syminfo.tickerid, "D", [open,close], lookahead = barmerge.lookahead_on)
rsi3 = ta.rsi(close[5],rsi5)

ma = ta.ema(close,in_emaperiod)

plot(rsi7,"5 Day RSI",color.red)
plot(lastClose,"Previous Days Close",color.green)
plot(lastOpen,"Previous Days Open",color.white)
plot(rsi3,"Previous 5th candles RSI",color.purple)
plot(ma,"200 EMA",color.blue)


//sell = ta.crossunder(rsi7,70) and ta.crossunder(rsi14,70) and ta.crossunder(rsi21,70)
//buy = ta.crossover(rsi7,in_lowerRSI) and close < ma and rsi3 <= in_upperRSI and strategy.opentrades < in_openOrders
//sell = ta.crossunder(rsi7,in_upperRSI) and close > ma and rsi3 >= in_lowerRSI3 and strategy.opentrades < in_openOrders

//buy condition
buy = ta.crossover(rsi7,in_lowerRSI) and close < ma and close < lastClose and strategy.opentrades < in_openOrders

// sell condition
sell = ta.crossunder(rsi7,in_upperRSI) and close > ma and close > lastClose and strategy.opentrades < in_openOrders


var lastBuy = close
var lastSell = close
//var buyLabel = label.new(na,na,yloc = yloc.belowbar, style = label.style_none, textcolor = color.green, size = size.normal)
//var sellLabel = label.new(na,na,yloc = yloc.abovebar, style = label.style_none, textcolor = color.red, size = size.normal)
if (buy)
    strategy.entry("BUY", strategy.long,alert_message = "Buy @"+str.tostring(close))
    lastBuy := close
    //buyLabel := label.new(na,na,yloc = yloc.belowbar, style = label.style_none, textcolor = color.green, size = size.normal)
    //label.set_x(buyLabel,bar_index)
    //label.set_y(buyLabel,low)
    //label.set_text(buyLabel,"Buy!!@ " +str.tostring(lastBuy)  + "\n TP: " + str.tostring(lastBuy*in_buyTP) + "\n↑")
    if(not in_useAlerts)
        alert("Buy")

//label.delete(buyLabel)

if ((close >= lastBuy*in_buyTP ) or (rsi7 > in_buybreakout) and close >= lastClose and (close >= lastClose*in_buyTP or close >= lastBuy*in_buyTP ) )
    //label.new(bar_index,na,"TP!!@ " +str.tostring(close), yloc = yloc.abovebar, style = label.style_none, textcolor = color.green, size = size.normal)
    strategy.close("BUY", "BUY Exit",alert_message = "Buy Exit: TP @" +str.tostring(close) + " OR TP: " + str.tostring(lastBuy*in_buyTP))
    if(not in_useAlerts)
        alert("Buy Exit")

if (sell)
    strategy.entry("SELL", strategy.short, alert_message = "Sell @ " + str.tostring(close))
    lastSell := close
    //sellLabel := label.new(na,na,yloc = yloc.abovebar, style = label.style_none, textcolor = color.red, size = size.normal)
    //label.set_x(sellLabel,bar_index)
    //label.set_y(sellLabel,high)
    //label.set_text(sellLabel,"Sell!!@ " +str.tostring(lastSell)  + "\n TP: " + str.tostring(lastSell*in_sellTP) + "\n🠇")
    if(not in_useAlerts)
        alert("Sell")

//label.delete(sellLabel)

if ( close < ma and (close <= lastSell*in_sellTP ) or (close < lastClose*in_sellTP) )
    //label.new(bar_index,na,"TP!!@ " +str.tostring(close), yloc = yloc.belowbar, style = label.style_none, textcolor = color.red, size = size.normal)
    strategy.close("SELL", "Sell Exit", alert_message = "Sell Exit TP @" +str.tostring(close) + " OR TP: " + str.tostring(lastSell*in_sellTP))
    if(not in_useAlerts)
        alert("Sell Exit")


alertcondition(buy and in_useAlerts,"Buy Alert","test")