Identifikasi kuantitatif strategi fase akumulasi

Ringkasan
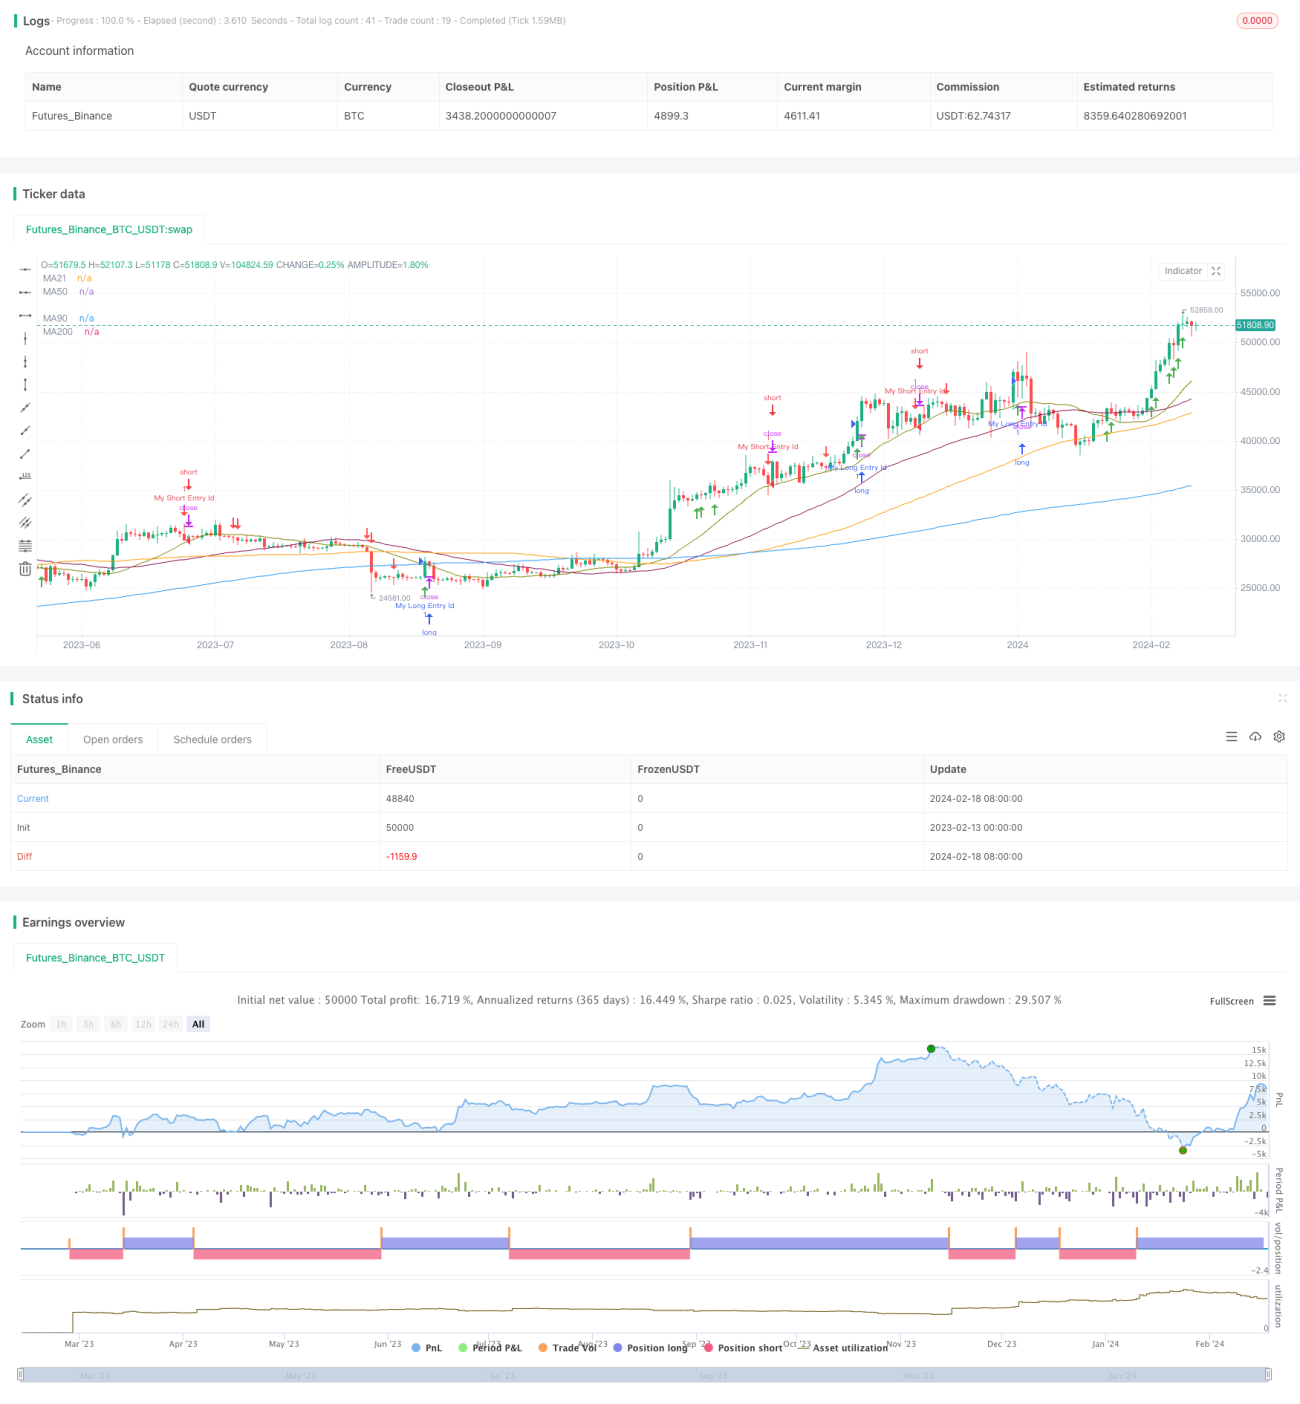
Strategi ini menggunakan kombinasi dari moving averages, volume of trade, dan price momentum indicator untuk merancang seperangkat aturan kuantitatif untuk mengidentifikasi kapan saham memasuki tahap akumulasi. Pada tahap ini, saham biasanya berada dalam kondisi harga yang stabil dan bergejolak, memberikan peluang bagus untuk masuk dengan harga yang lebih rendah.
Prinsip Strategi
Strategi ini menggunakan 50-, 90- dan 200-hari moving average sederhana untuk menentukan tren harga. Hanya ketika harga berada di atas garis 200 hari, sinyal beli dihasilkan. Ini dapat menyaring ketidakpastian penurunan tren besar.
Selain menilai tren besar, strategi juga menilai urutan garis rata-rata jangka pendek untuk mengkonfirmasi tren. Secara khusus, menilai garis 50 lebih tinggi dari garis 90.
Strategi ini menggabungkan indikator volume transaksi PVT dan MACD untuk menilai karakteristik akumulasi, berdasarkan pada apakah rata-rata bergerak mengkonfirmasi tren besar dan tren jangka pendek memenuhi syarat. Sinyal beli hanya akan dihasilkan ketika PVT menerobos ke atas, garis MACD lebih tinggi dari garis sinyal dan volume transaksi meningkat.
Keunggulan Strategis
Berbeda dengan menggunakan moving average saja, strategi ini mengkonfirmasi tren dan juga memeriksa karakteristik volume transaksi. Ini dapat lebih akurat menentukan kapan saham memasuki tahap akumulasi, sehingga memastikan keuntungan harga masuk.
Strategi ini menggabungkan penilaian tren jangka menengah dan jangka panjang dengan penilaian karakteristik jangka pendek melalui analisis beberapa kerangka waktu. Pencocokan kerangka waktu dapat mengurangi ketidakpastian akibat kesalahan penilaian kerangka waktu tunggal.
Risiko dan Solusi
Strategi ini terutama bergantung pada penilaian rata-rata, dan penilaian rata-rata tidak akan berlaku ketika harga mengalami fluktuasi yang kuat. Pada saat ini, ukuran posisi harus dikurangi, atau langsung menghentikan kerugian keluar.
Selain itu, penilaian pada tahap akumulasi juga dapat salah, sehingga kehilangan kesempatan untuk membalikkannya. Ini perlu dikonfirmasi dengan melihat lebih banyak indikator karakteristik.
Optimalkan Pikiran
Strategi ini dapat memperkenalkan algoritma pembelajaran mesin untuk membuat penilaian otomatis pada tahap akumulasi melalui ekstraksi karakteristik dan pelatihan model. Ini dapat mengurangi keterbatasan yang disebabkan oleh penetapan nilai ambang manual.
Selain itu, strategi ini juga dapat mencoba fungsi breakpoint, yang secara otomatis beralih parameter yang berbeda dalam lingkungan pasar yang berbeda, untuk membuat strategi lebih kasar.
Meringkaskan
Strategi ini secara keseluruhan menggunakan cara yang sesuai dengan harga dan volume transaksi untuk menilai karakteristik akumulasi saham. Menggali peluang akumulasi jangka pendek sambil mengkonfirmasi arah besar.
- 1