Strategi breakout berbasis momentum

Ringkasan
Strategi Dynamic Breakout adalah strategi tren yang melacak dinamika pasar. Strategi ini menggabungkan beberapa indikator untuk menentukan apakah pasar saat ini sedang dalam tren naik atau turun, dan melakukan over-posisi saat melewati titik resistensi kunci, dan posisi kosong saat melewati titik dukungan kunci.
Prinsip Strategi
Strategi ini digunakan untuk menilai tren pasar dan titik harga kunci dengan menghitung berbagai saluran Donchian jangka panjang. Secara khusus, strategi ini menilai tren naik ketika harga menembus siklus yang lebih panjang seperti saluran Donchian selama 40 hari, dan berdasarkan pada itu, ia membuat beberapa sinyal yang digabungkan dengan kondisi penyaringan seperti tinggi baru sepanjang tahun, urutan berorientasi rata-rata bergerak, dan sebagainya.
Dalam hal keluar dari posisi, strategi ini menawarkan dua pilihan: garis pembatalan tetap dan tracking stop loss. Garis pembatalan tetap adalah stop loss yang ditetapkan berdasarkan periode yang lebih pendek seperti saluran Donchian 20 hari; dan tracking stop loss adalah stop loss floating yang dihitung berdasarkan nilai ATR setiap hari.
Analisis Keunggulan
Strategi ini menggabungkan pengertian tren dan operasi breakout, yang dapat secara efektif menangkap peluang arah garis pendek di pasar. Dibandingkan dengan indikator tunggal, ini menggunakan berbagai kondisi penyaringan secara komprehensif, yang dapat menyaring beberapa false breakout dan meningkatkan kualitas sinyal masuk. Selain itu, penggunaan strategi stop loss juga membuatnya lebih tahan, bahkan jika ada perubahan jangka pendek dalam situasi, dapat secara efektif mengendalikan kerugian.
Analisis risiko
Risiko utama dari strategi ini adalah bahwa pasar dapat berfluktuasi secara dramatis, menyebabkan stop loss yang dipicu untuk keluar dari posisi. Jika pasar berbalik dengan cepat, peluang dapat dilewatkan. Selain itu, penggunaan berbagai kondisi penyaringan juga akan menyaring sebagian peluang, mengurangi frekuensi memegang posisi strategi.
Untuk mengurangi risiko, nilai ATR dapat disesuaikan dengan tepat atau jarak orbit Donchian dapat diperluas, yang dapat mengurangi kemungkinan stop loss akan ditembus. Juga dapat mengurangi atau membatalkan sebagian dari kondisi penyaringan, meningkatkan frekuensi masuk, tetapi risiko juga akan meningkat.
Arah optimasi
Strategi ini dapat dioptimalkan dalam beberapa hal:
- Optimalkan panjang saluran Donchian untuk mencari kombinasi parameter yang optimal
- Mencoba berbagai jenis moving average sebagai indikator fluktuasi
- Menyesuaikan ATR kali atau berubah menjadi stop loss
- Menambahkan lebih banyak indikator untuk menilai tren, seperti MACD
- Mengoptimalkan periode jendela penilaian yang tinggi dan rendah sepanjang tahun dan sebagainya
Dengan menguji parameter yang berbeda, kombinasi optimal dapat ditemukan dan keseimbangan antara risiko dan keuntungan dapat dicapai.
Meringkaskan
Strategi ini mengintegrasikan beberapa indikator untuk menentukan arah tren, dan mengirimkan sinyal perdagangan saat titik-titik penting terobosan. Mekanisme stop loss juga membuat strategi ini memiliki kemampuan kontrol risiko yang lebih kuat. Dengan pengaturan parameter yang dioptimalkan, strategi ini dapat mencapai keuntungan tambahan yang stabil.
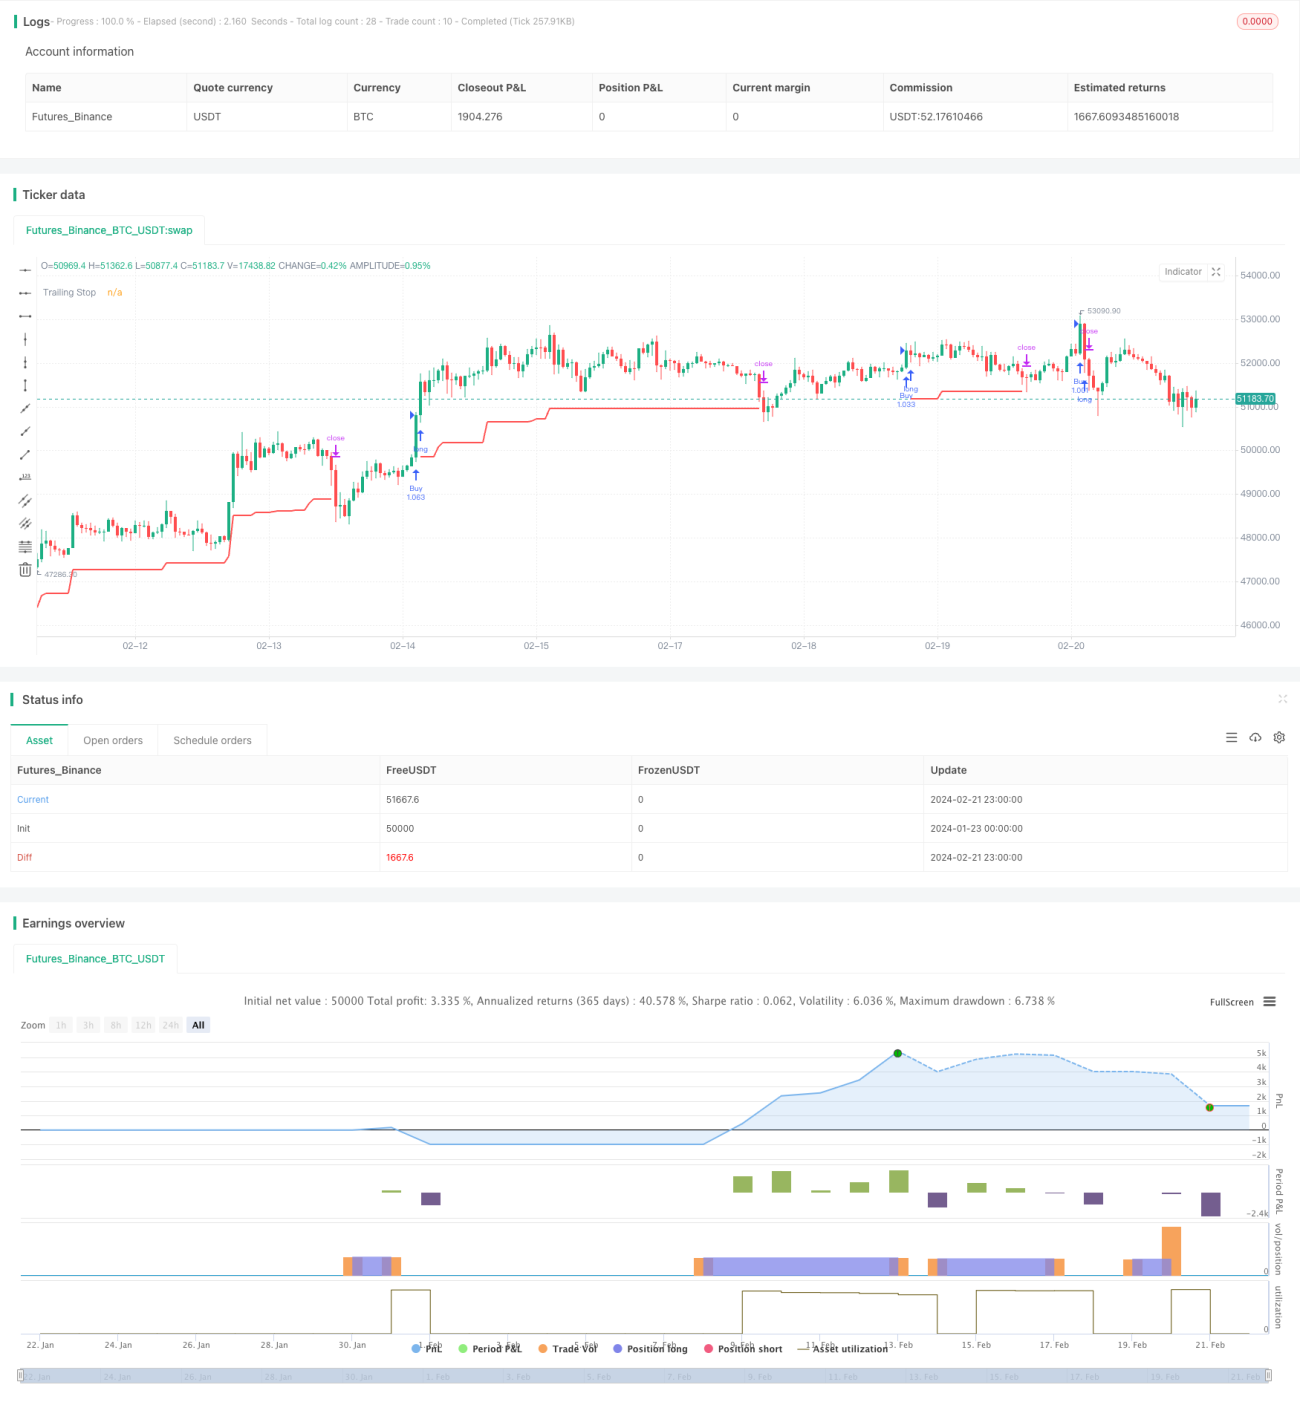
/*backtest
start: 2024-01-23 00:00:00
end: 2024-02-22 00:00:00
period: 1h
basePeriod: 15m
exchanges: [{"eid":"Futures_Binance","currency":"BTC_USDT"}]
*/

// This source code is subject to the terms of the Mozilla Public License 2.0 at https://mozilla.org/MPL/2.0/
// © HeWhoMustNotBeNamed

//@version=4- 1