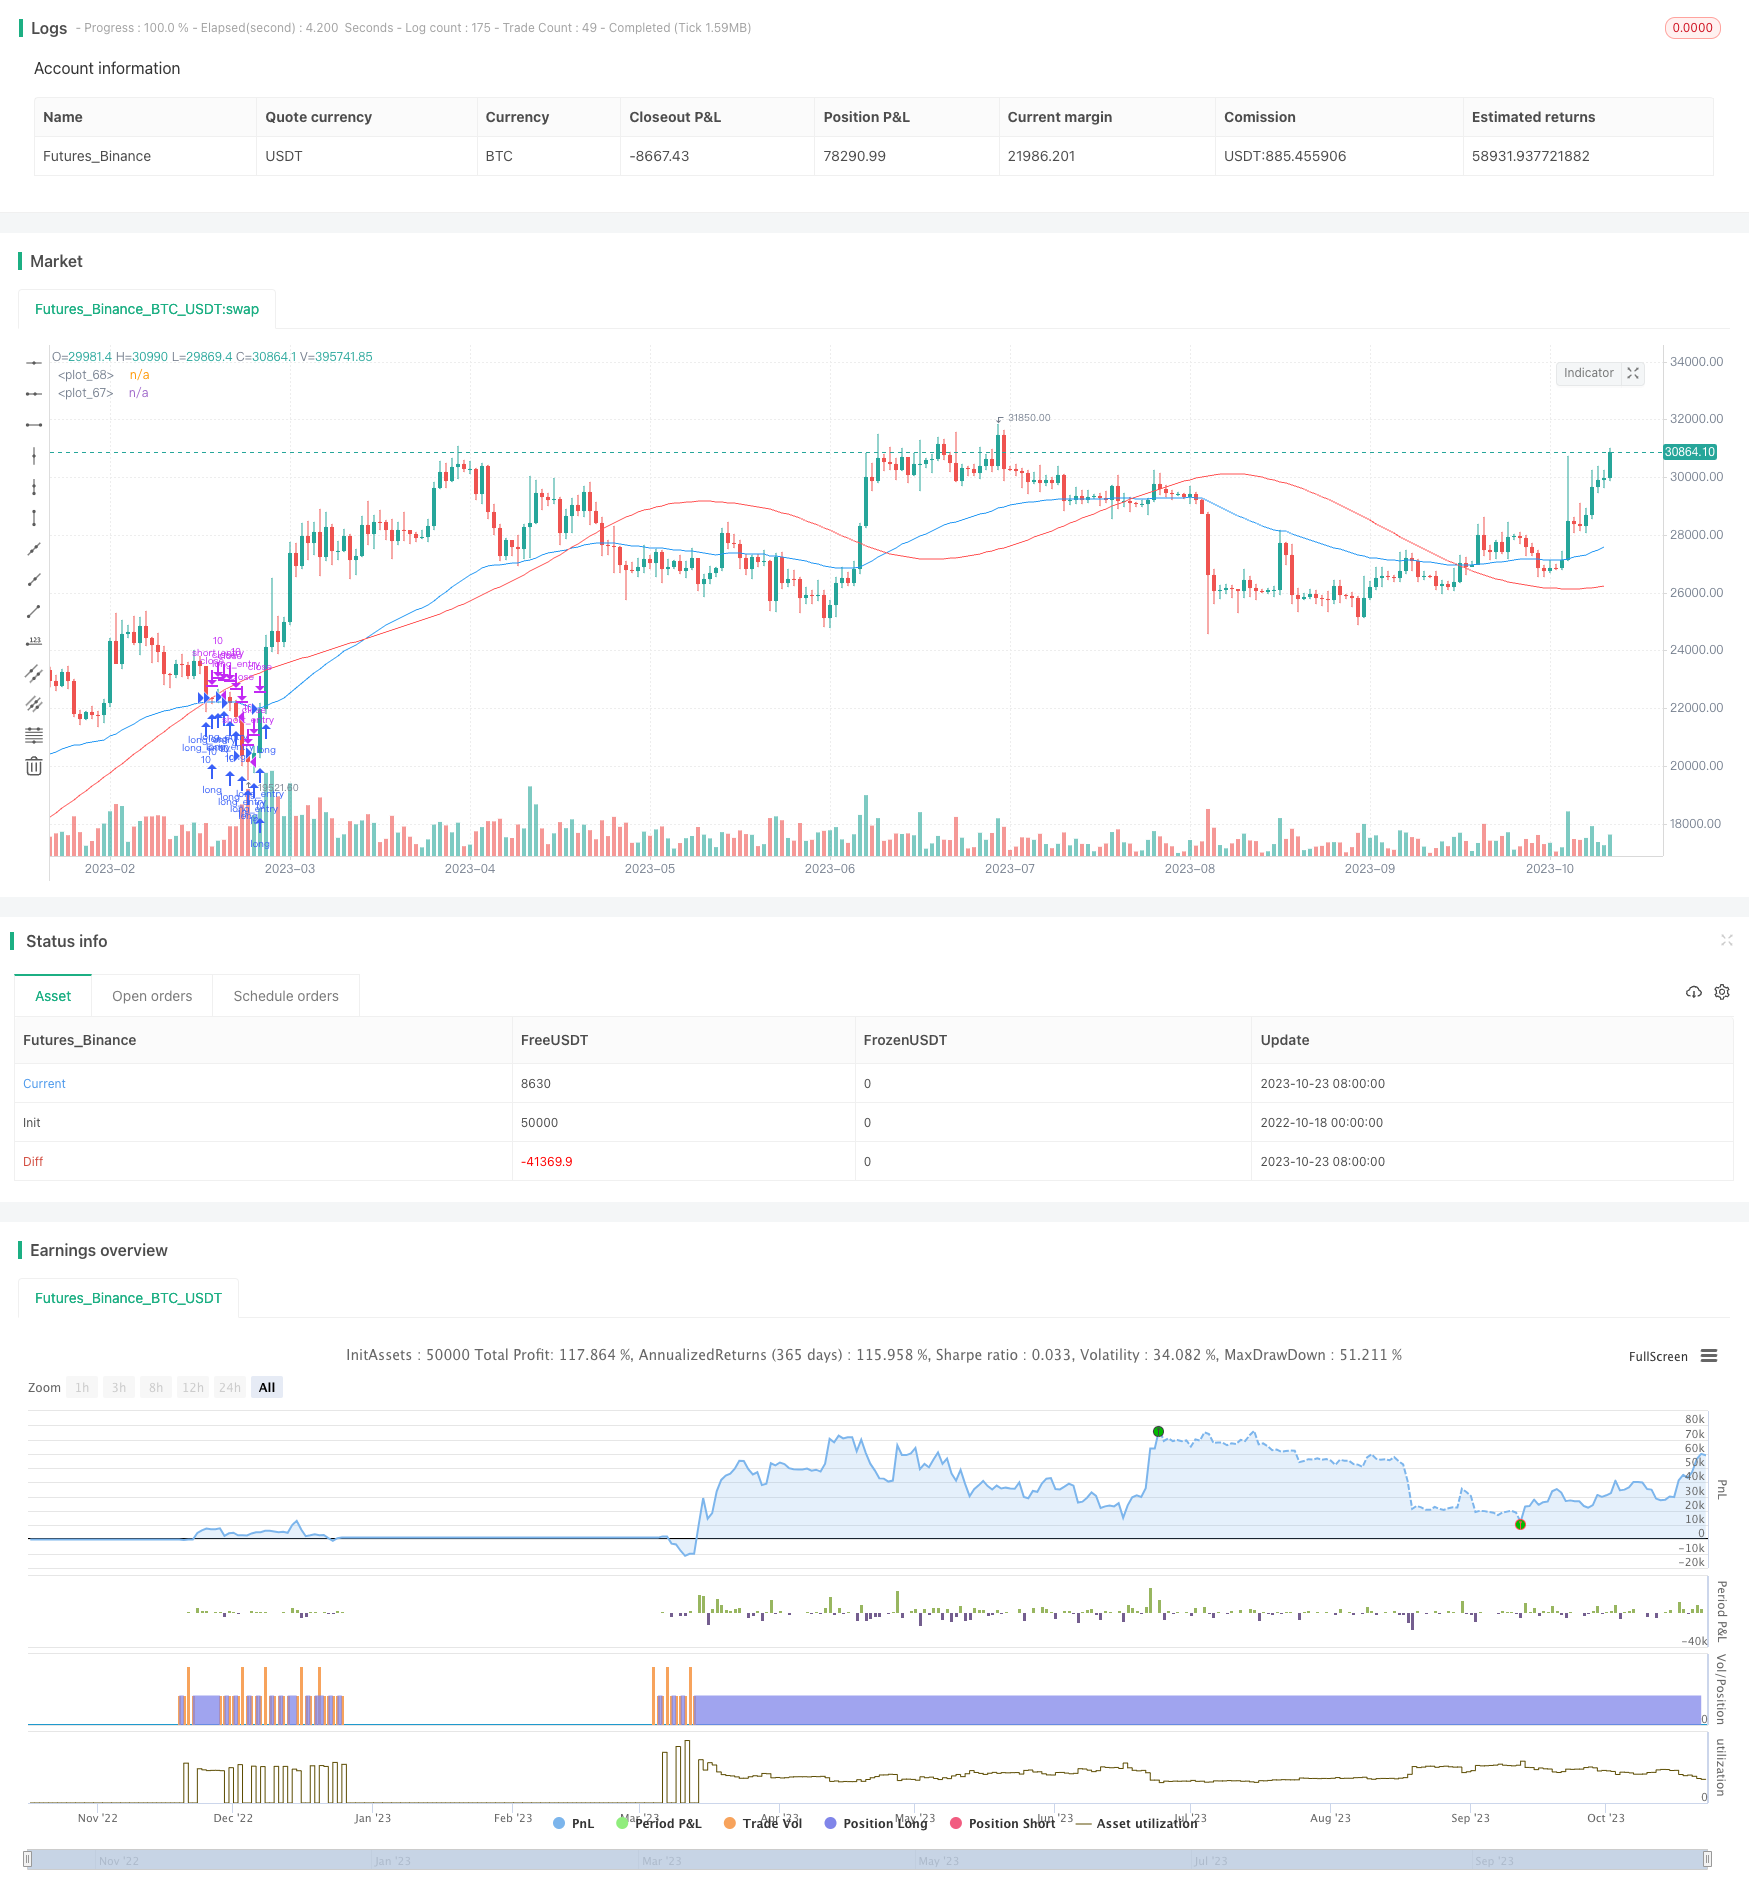
移動平均回帰取引戦略

概要
均線回帰取引戦略は,株価の線形回帰線と均線の交差を計算して買入と売却の信号を決定する.この戦略は,均線と線形回帰分析を組み合わせて,株価の傾向を考慮するとともに,統計学的特性を考慮して,株価の逆転点を効果的に判断し,低買い高売りを実現する.
戦略原則
この戦略は,まずn日間の株価の線形回帰線とm日間の平均線を計算する.線形回帰線は,株価の長期的統計的傾向を反映し,平均線は,株価の短期的動きを反映する.
平均線上を通過する線性回帰線は,株価の上昇勢いが強化され,買入シグナルが生じることを示す.平均線下を通過する線性回帰線は,株価が弱くなって,売り出せシグナルが生じることを示す.
具体的には,戦略は,次のステップで取引信号を判断します.
n日間の株価の線形回帰線lrLineを計算する
線形回帰線の m 日単数移動平均lrMA を計算する
株価を計算する m 日指数 移動平均ema
エマがlrMAを穿戴すると,longEntryの買入信号が生成される.
メールがlrMAを突破すると,longExitのセールスシグナルが生成されます.
また,大盤の判断と合わせて,大盤が牛市であるときのみ,買入シグナルを考慮する.
シグナルで取引する
平均線と回帰線の交差によって,買い買いのタイミングを判断し,偽破りを効果的にフィルターし,反転点を捕捉し,低買い高売りを実現する.
戦略的優位性
- 回帰線は長期トレンドを反映し,平均線は短期トレンドを反映し,二重指標を組み合わせると,買い値と売却点を正確に判断できます.
- リグレーション・ラインはシンプルで簡単に実行できます.
- 大幅の判断により,不適切な取引信号をフィルターできます.
- 顧客が購入する商品は,顧客が購入する商品の価格で決まります.
- スペースの利潤は大きい
戦略リスク
- 株価が急激に波動する時には,平均線と回帰線が交差することが多く,誤った信号を生じることがあります.
- 大盘の判断が不正確なら,買い物タイミングも間違える
- パラメータを正しく設定しない場合も, 策略の効果に影響します.
- 取引が頻繁で,取引コストが高くなる
注目すべきパラメータ調整,適正に拡大平均線と回帰線周期パラメータ,取引頻度を減らす.合理的なストップ・ロース戦略の設定,リスク制御.大盤判断ルールの最適化,正確性の向上.
戦略の最適化
この戦略は以下の点で最適化できます.
平均線指数最適化:重み付けの移動平均など,異なる種類の平均線を試して,その株式に最適な平均線を見つける.
回帰線最適化:回帰線計算周期を調整し,その株の長期トレンドを最も反映する周期パラメータを探します.
大盘判断最適化:異なる大盘判断指標をテストし,戦略に最も適した大盘信号を見つける.
パラメータ最適化:異なるパラメータ組み合わせを繰り返し反省して,最適なパラメータ配置を探します.
ストップ戦略の最適化:異なるストップ方法をテストし,リスクを制御するために最適なストップロジックを設定する.
取引コストの最適化:異なる取引手数料モデルに応じて,取引の頻度を調整して取引コストを減らす.
戦略の安定性や収益性をさらに向上させるには,上記のポイントを最適化する必要があります.
要約する
この均線回帰取引戦略は,均線分析と線形回帰分析を統合した優位性があり,株価の逆転点を効果的に識別し,低価格,高価格を誘導する.戦略は,単純で信頼性が高く,中長期線オプションの取引に適しています.パラメータ最適化とリスク管理により戦略の安定性をさらに向上させることができます.この戦略は,株式市場分析のための実行可能な技術取引方案を提供します.
/*backtest
start: 2022-10-18 00:00:00
end: 2023-10-24 00:00:00
period: 1d
basePeriod: 1h
exchanges: [{"eid":"Futures_Binance","currency":"BTC_USDT"}]
*/

// This source code is subject to the terms of the Mozilla Public License 2.0 at https://mozilla.org/MPL/2.0/
// © lazy_capitalist

//@version=5
strategy('Linear Regression MA', overlay=true, initial_capital=10000)
datesGroup = "Date Info"
startMonth = input.int(defval = 1,    title = "Start Month",  minval = 1, maxval = 12,  group=datesGroup)
startDay   = input.int(defval = 1,    title = "Start Day",    minval = 1, maxval = 31,  group=datesGroup)
startYear  = input.int(defval = 2022, title = "Start Year",   minval = 1970,            group=datesGroup)

averagesGroup = "Averages"
lrLineInput     = input.int(title="Linear Regression Line",   defval=55, minval = 1, group=averagesGroup)
lrMAInput       = input.int(title="Linear Regression MA",     defval=55, minval = 1, group=averagesGroup)
emaInput        = input.int(title="EMA Length",               defval=55, minval = 1, group=averagesGroup)


tradesGroup = "Execute Trades"
executeLongInput    = input.bool(title="Execute Long Trades",       defval=true)
executeShortInput   = input.bool(title="Execute Short Trades",      defval=true)
executeStopLoss     = input.bool(title="Execute Stop Loss",         defval=true)

fourHrSMAExpr       = ta.sma(close, 200)
fourHrMA            = request.security(symbol=syminfo.tickerid, timeframe="240", expression=fourHrSMAExpr)

bullish             = close > fourHrMA ? true : false


maxProfitInput              = input.float(  title="Max Profit (%)",         defval=10.0,    minval=0.0)   * 0.01
stopLossPercentageInput     = input.float(  title="Stop Loss (%)",          defval=1.75,    minval=0.0)   * 0.01

start       = timestamp(startYear, startMonth, startDay, 00, 00)            // backtest start  window
window()    => time >= start ? true : false                              // create function "within window of time"
showDate    = input(defval = true, title = "Show Date Range")

lrLine = ta.linreg(close, lrLineInput, 0)
lrMA   = ta.sma(lrLine, lrMAInput)
ema     = ta.ema(close, emaInput)

longEntry   = ema   < lrMA
longExit    = lrMA  < ema

shortEntry  = lrMA  < ema
shortExit   = ema   < lrMA


maxProfitLong   = strategy.opentrades.entry_price(0) * (1 + maxProfitInput)
maxProfitShort  = strategy.opentrades.entry_price(0) * (1 - maxProfitInput)

stopLossPriceShort  = strategy.position_avg_price * (1 + stopLossPercentageInput)
stopLossPriceLong   = strategy.position_avg_price * (1 - stopLossPercentageInput)

if(executeLongInput and bullish)
    strategy.entry( id="long_entry", direction=strategy.long,   when=longEntry and window(),    qty=10,  comment="long_entry")
    strategy.close( id="long_entry", when=longExit,     comment="long_exit")
    // strategy.close( id="long_entry", when=maxProfitLong <= close, comment="long_exit_mp")

if(executeShortInput and not bullish)
    strategy.entry( id="short_entry", direction=strategy.short,   when=shortEntry and window(),    qty=10,  comment="short_entry")
    strategy.close( id="short_entry", when=shortExit,     comment="short_exit")
    // strategy.close( id="short_entry", when=maxProfitShort <= close, comment="short_exit_mp")

if(strategy.position_size > 0 and executeStopLoss)
    strategy.exit(  id="long_entry",        stop=stopLossPriceLong,             comment="exit_long_SL")
    strategy.exit(  id="short_entry",       stop=stopLossPriceShort,            comment="exit_short_SL")

// plot(series=lrLine,     color=color.green)
plot(series=lrMA,       color=color.red)
plot(series=ema,        color=color.blue)