
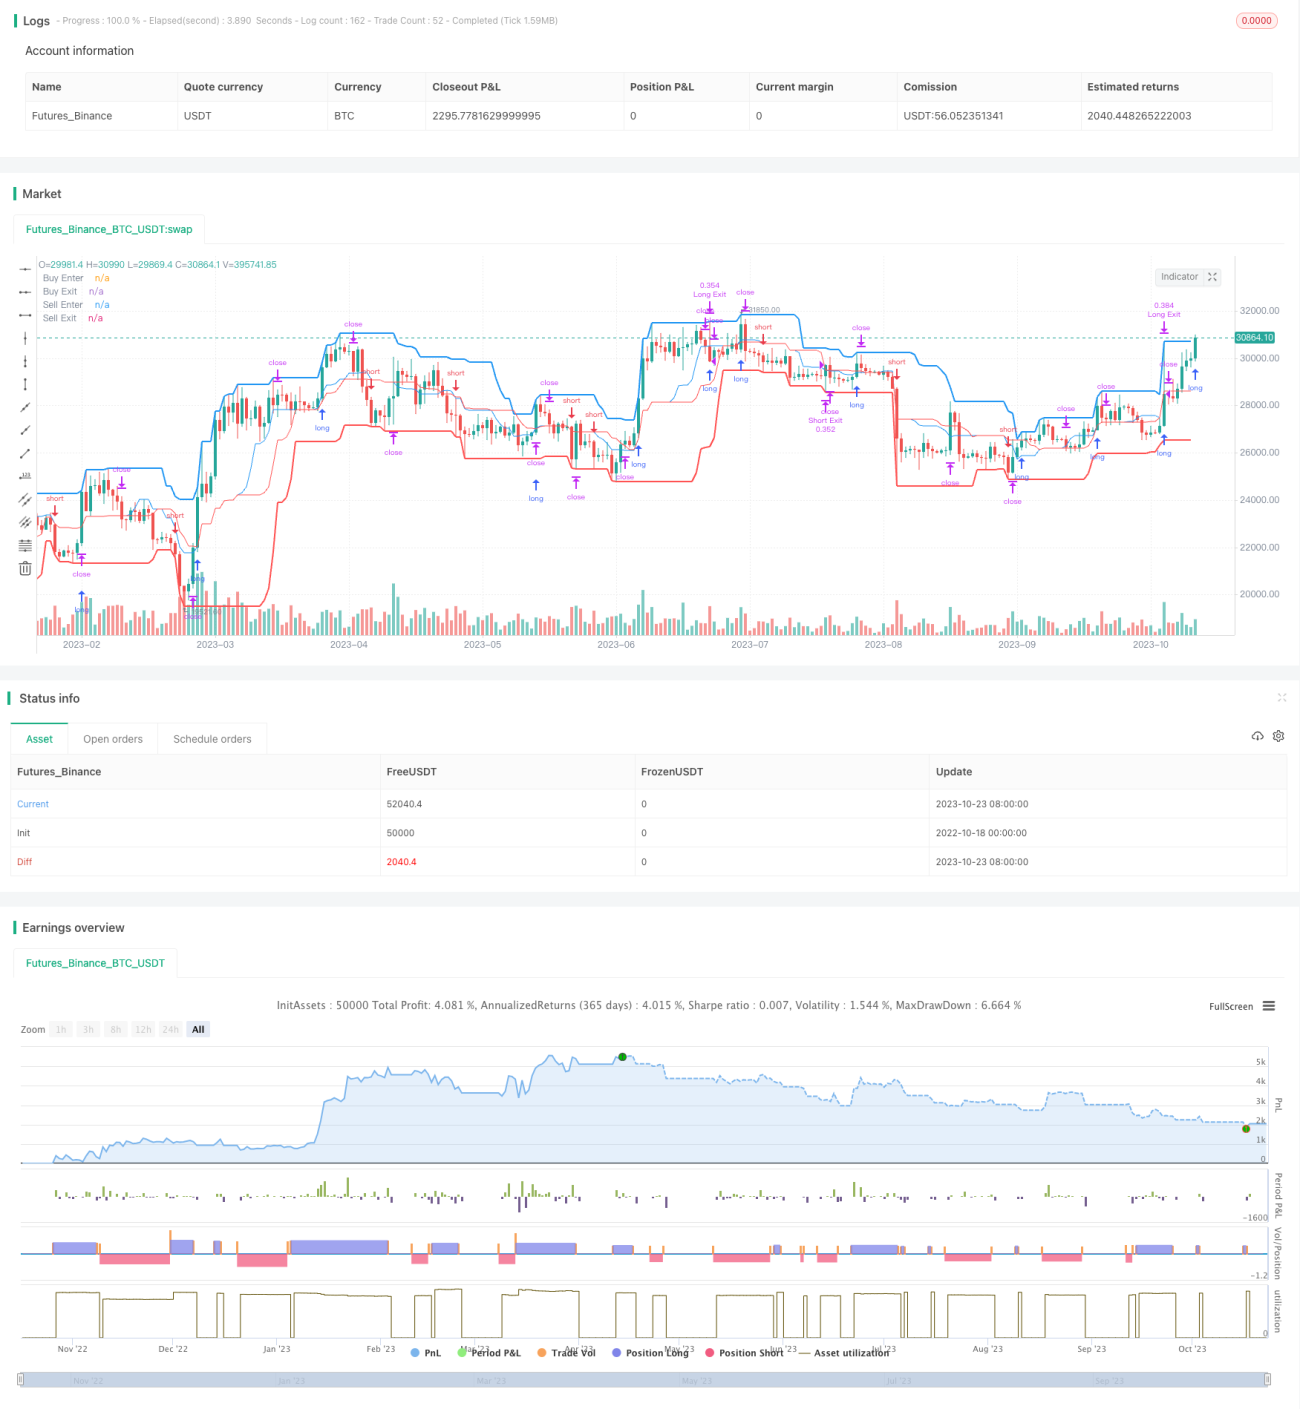
この戦略は,通道指標に基づく短期取引戦略である.通道上下軌道の突破を利用してトレンドの始まりと終わりを判断し,その後,買入決定を行う.強いトレンド市場では,このような突破戦略は,より良い利益を得ることができる.
この戦略は,ある周期内の最高価格と最低価格を計算し,通路の上線と下線を構成する.
値上がりが上線を突破すると,多入場する。値下がりが下線を突破すると,空き入場する。
モバイル・ストップを使用してリスクを制御する.ストップラインを通路として設定する中線.
2つの選択可能な退出ルールは,回帰中線と移動ストップである.前者は,迅速な利益の退出を実現し,後者は,リスクを制御する.
市場環境に応じて通路周期を選択し,ストップ・ローズ幅などのパラメータを調整し,戦略の最適化を実現することができる.
操作は簡単で実行しやすい.ただ,価格と通路の関係を監視し,規則に従って平仓を開くだけです.
逆転の危険性のないトレンドトレード.
入り口は清晰で直感的で,入口信号がはっきりしています.
収益の余地があり,通常,満足のいく報酬が得られます.
調整可能なパラメータが多く,異なる市場向けに最適化できます.
突破は成功するとは限らず,罠にかけられる危険性がある.
経路は周期的な形成を必要とし,震動の状況には適用されない.
経路の中央線の止まりは保守的で,トレンドを維持できないかもしれない.
パラメータ最適化には,過去データによるサポートが必要で,リールディスクに最適化があった可能性があります.
機械的な取引の破綻は,取引の回数とスライドポイントのコストを増加させる可能性があります.
異なる周期パラメータの効果を評価し,最適な通路周期を選択する.
回帰中線停止と移動停止をテストし,より適切な退出機構を選択する.
ストップダメージの幅を最適化して,ストップダメージがトリガーされる確率を低減する.
取引先は,取引先の取引状況に合わせて,取引先の取引状況に合わせて,取引先の取引状況に合わせて,
リスクの管理を考慮してポジションを拡大する
この戦略は,全体として,より成熟した短期突破戦略である。入場ルールは明確であり,リスク管理策が設けられ,運用効果は良好である。パラメータ最適化により戦略のパフォーマンスをさらに改善することができる。しかし,依然としていくつかの固有の欠陥を注意し,異なる市場に対応して調整する必要がある。システムがこの戦略を使用すれば,全体的な収益は確保できるべきである。
/*backtest
start: 2022-10-18 00:00:00
end: 2023-10-24 00:00:00
period: 1d
basePeriod: 1h
exchanges: [{"eid":"Futures_Binance","currency":"BTC_USDT"}]
*/
// This source code is subject to the terms of the Mozilla Public License 2.0 at https://mozilla.org/MPL/2.0/
// Strategy testing and optimisation for free Bitmex trading bot
// © algotradingcc
//@version=4
strategy("Channel Break [for free bot]", overlay=true, default_qty_type= strategy.percent_of_equity, initial_capital = 1000, default_qty_value = 20, commission_type=strategy.commission.percent, commission_value=0.075)
//Options
buyPeriod = input(13, "Channel Period for Long position")
sellPeriod = input(18, "Channel Period for Short position")
isMiddleExit = input(true, "Is exit on Base Line?")
takeProfit = input(46, "Take Profit (%) for position")
stopLoss = input(9, "Stop Loss (%) for position")
// Test Start
startYear = input(2005, "Test Start Year")
startMonth = input(1, "Test Start Month")
startDay = input(1, "Test Start Day")
startTest = timestamp(startYear,startMonth,startDay,0,0)
//Test End
endYear = input(2050, "Test End Year")
endMonth = input(12, "Test End Month")
endDay = input(30, "Test End Day")
endTest = timestamp(endYear,endMonth,endDay,23,59)
timeRange = time > startTest and time < endTest ? true : false
// Long&Short Levels
BuyEnter = highest(buyPeriod)
BuyExit = isMiddleExit ? (highest(buyPeriod) + lowest(buyPeriod)) / 2: lowest(buyPeriod)
SellEnter = lowest(sellPeriod)
SellExit = isMiddleExit ? (highest(sellPeriod) + lowest(sellPeriod)) / 2: highest(sellPeriod)
// Plot Data
plot(BuyEnter, style=plot.style_line, linewidth=2, color=color.blue, title="Buy Enter")
plot(BuyExit, style=plot.style_line, linewidth=1, color=color.blue, title="Buy Exit", transp=50)
plot(SellEnter, style=plot.style_line, linewidth=2, color=color.red, title="Sell Enter")
plot(SellExit, style=plot.style_line, linewidth=1, color=color.red, title="Sell Exit", transp=50)
// Calc Take Profits & Stop Loss
TP = 0.0
SL = 0.0
if strategy.position_size > 0
TP := strategy.position_avg_price*(1 + takeProfit/100)
SL := strategy.position_avg_price*(1 - stopLoss/100)
if strategy.position_size > 0 and SL > BuyExit
BuyExit := SL
if strategy.position_size < 0
TP := strategy.position_avg_price*(1 - takeProfit/100)
SL := strategy.position_avg_price*(1 + stopLoss/100)
if strategy.position_size < 0 and SL < SellExit
SellExit := SL
// Long Position
if timeRange and strategy.position_size <= 0
strategy.entry("Long", strategy.long, stop = BuyEnter)
strategy.exit("Long Exit", "Long", stop=BuyExit, limit = TP, when = strategy.position_size > 0)
// Short Position
if timeRange and strategy.position_size >= 0
strategy.entry("Short", strategy.short, stop = SellEnter)
strategy.exit("Short Exit", "Short", stop=SellExit, limit = TP, when = strategy.position_size < 0)
// Close & Cancel when over End of the Test
if time > endTest
strategy.close_all()
strategy.cancel_all()