
この戦略は,相対的に強い指数 (RSI) の指標に基づいて多空の自動取引システムを設計した.これは,RSIがオーバーバイオーバーソール領域に達すると,自動的に多空シグナルを発して自動取引を行うことができる.
この戦略は,一定の周期内の株価の上昇・下降を計算することによって,0-100の範囲のRSI値を得ます. RSIが30を下回ると超売り状態で,70を超えると超買い状態です. この規則に従って,RSIが超売り領域に到達すると自動的にプラスし,超買い領域に到達すると自動的に空白します.
具体的には,戦略は最初に15サイクルRSI値を計算する. RSIが20を下回ると,超売り状態にあると考えられ,その時に200日移動平均線上を突破すると,多入場する. RSIが80を超えると,超買い状態にあると考えられ,その時に空売り状態になる.
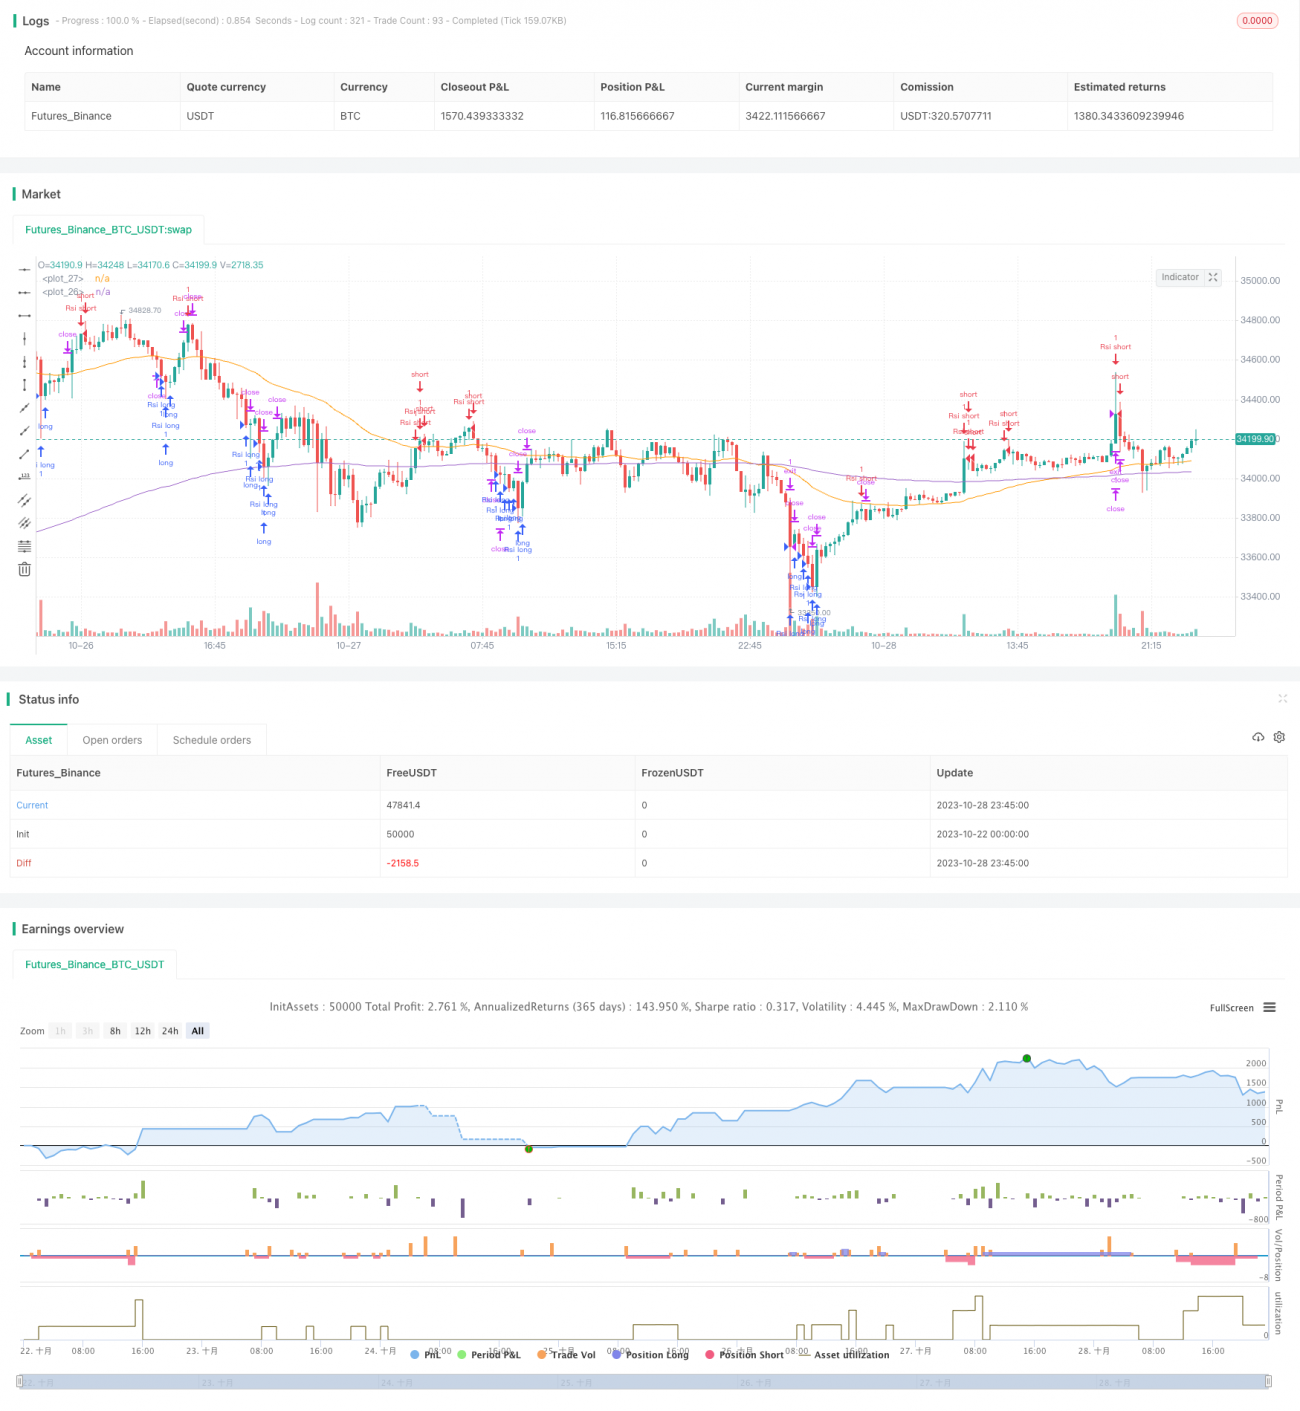
また,この戦略は,価格がシグナルを発生したとき,関連するマークラインとタグを描画し,取引シグナルをより直感的にします.
リスク管理策には,RSIパラメータの最適化,異なる品種に適した超買超売り値の調整,合理的な止損ポイントの設定,トレンド指標と組み合わせた逆転取引の回避が含まれます.
この戦略overallは,RSI指標を用いた超買い超売り判断の自動取引戦略である. RSI指標が超買い超売り極域に達したときに取引信号を発信し,自動で取引を行うことができる. 戦略の構想はシンプルで明確で,容易に実装され,自動取引の基本策として適合する. しかし,RSI指標にはある程度の遅れがあるため,信号の正確性を高めるために他の指標と組み合わせて最適化することを推奨する.
/*backtest
start: 2023-10-22 00:00:00
end: 2023-10-29 00:00:00
period: 15m
basePeriod: 5m
exchanges: [{"eid":"Futures_Binance","currency":"BTC_USDT"}]
*/
//@version=5
strategy("RSI Improved strategy", overlay=true)
higherTF1 = input.timeframe('15' , "Resolution", options = ['5', '15', '1H', 'D', 'W', 'M'])
dailyopen = request.security(syminfo.tickerid, higherTF1, close)
Reward = input(1600)
Risk = input(1600)
length = input( 5 )
overSold = input( 30 )
overBought = input( 70 )
EMA = input(200)
price = close
vrsi = ta.rsi(price, length)
RSIlowest = vrsi[1] > vrsi ? true : false
RSIhighest = vrsi[1] < vrsi ? true : false
//ro = ta.crossunder(vrsi, 20)
//ru = ta.crossover(vrsi, 80)
co = ta.crossunder(vrsi, overSold)
cu = ta.crossunder(vrsi, overBought)
plot(ta.ema(close, EMA))
plot(ta.ema(close, 50), color = color.orange)
UponEMA = close > ta.ema(close, EMA) ? true : false
belowEMA = close < ta.ema(close, EMA) ? true : false
//transfer 'float' to 'int' to 'string'
r = int(vrsi)
value = str.tostring(r)
m = int(strategy.openprofit)
money = str.tostring(m)
if (not na(vrsi))
//when price stand up on 200ema and rsi is at oversold area, open long position
// if (co and UponEMA)
// strategy.order("Rsi long", strategy.long, 1 , comment = "Rsi long")
if(vrsi < 20 and RSIlowest)
// line1 = line.new(x1=bar_index, y1=dailyopen, x2=bar_index+1, y2=dailyopen, xloc=xloc.bar_index, style=line.style_solid,extend=extend.right, color=color.aqua, width = 2)
// line.delete(line1[1]) // remove the previous line when new bar appears
// label1 = label.new(x=bar_index, y=dailyopen,yloc=yloc.belowbar, text = value,textcolor = color.white, color = color.green, style = label.style_label_up)
// label.delete(label1[1])
strategy.order("Rsi long", strategy.long, 1 , comment = "Rsi long")
strategy.exit("exit", "Rsi long", profit = Reward, loss = Risk, comment = "Rsi long exit")
//strategy.close("Rsi short", comment = "Rsi close")
if(vrsi > 80 and RSIhighest)
// line2 = line.new(x1=bar_index, y1=dailyopen, x2=bar_index+1, y2=dailyopen, xloc=xloc.bar_index, style=line.style_solid,extend=extend.right, color = #e65100, width = 2)
// line.delete(line2[1]) // remove the previous line when new bar appears
// label2 = label.new(x=bar_index, y=dailyopen,yloc=yloc.abovebar, text = value, textcolor = color.white, color = color.red)
// label.delete(label2[1])
strategy.order("Rsi short",strategy.short, 1, comment = "Rsi short ")
strategy.exit("exit", "Rsi short", profit = Reward,loss = Risk, comment = "Rsi short exit")
// if(UponEMA)
// strategy.close("Rsi short", comment = "Rsi short close")
//plot(strategy.equity, title="equity", color=color.red, linewidth=2, style=plot.style_cross)
//plotshape(confirmPH, title="Label",offset = 1,text="Bull",style=shape.labeldown,location=location.abovebar,color=color.green,textcolor=color.green)
//when Rsi reaches overbought, draw a Horizontal Ray to close prices, similarly when it comes to oversold.(accomplished)
//detects when there is more lower/higher RSI values, adjust horizontal Ray and label to new posistion.(accomplished)