T3移動平均とATRに基づく取引戦略

概要
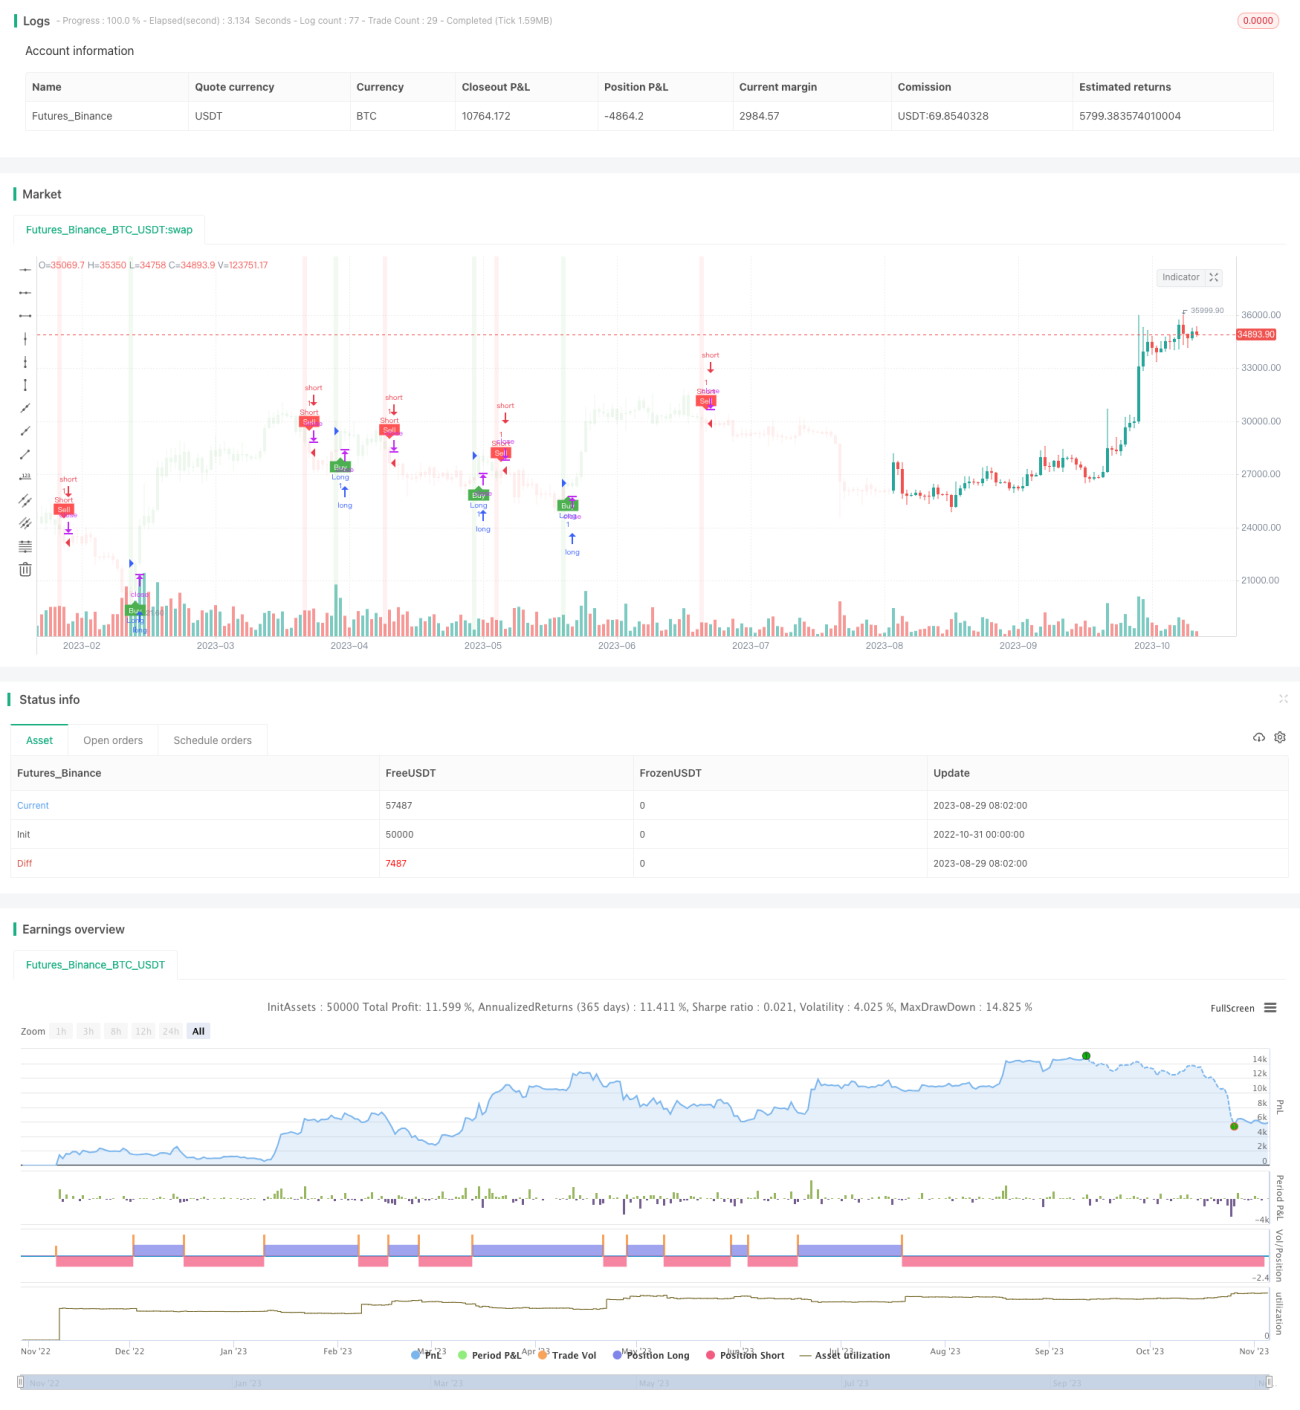
この戦略は,T3移動平均,ATR指数,ハイクルの組み合わせを使用して,買入と売却のシグナルを識別し,ATRに基づいてストップ・ストップ・ポジションを計算し,トレンドを追跡する取引を実現します.戦略の優点は,迅速な応答であり,取引リスクを制御することです.
原則分析
指標計算
-
T3移動平均:トレンドの方向を判断するために,T3 ((デフォルト100) の滑らかなパラメータであるT3移動平均を計算する.
-
ATR: ストップダストストップの位置の大きさを決定するために使用されるATR ((平均実際の波動幅) を計算する.
-
ATR移動ストップ:ATRに基づいて移動ストップラインを計算し,価格の変化と変動率に応じて調整することができ,トレンド追跡が可能である.
トランザクションロジック
-
買取シグナル:閉盤価格でATR移動ストップラインを穿越し,T3平均を下回ると買取シグナルが生じる.
-
売り込みシグナル: 売り込みシグナルは,ATR移動ストップラインを閉店価格の下を通過し,T3平均より上にあるときに発生します.
-
ストップ・ストップ:入場後,ATR値とユーザが設定したリスク・リターン比率に基づいてストップ・ストップ価格を計算する.
入場と出場の戦略
-
購入後,ストップ・ロスは入場価格からATRを減算し,ストップ・ストップは入場価格からATRを加算し,リスク・リターン・レート (RRR) を掛けます.
-
販売後,ストップ・ロスト価格は入場価格にATR値を加え,ストップ・ストップ価格は入場価格にATR値を減算し,リスク・リターン・レートに掛けます.
-
価格がストップ・ロースまたはストップ・プッシュの価格を触発すると,平仓を退場させる.
優位分析
迅速な対応
T3平均のパラメータは100をデフォルトで設定し,一般の移動平均よりも敏感で,価格の変化により迅速に反応することができる.
リスク管理
ATRを用いた移動ストップは,市場波動のトレイル価格に基づいてストップが突破されるリスクを回避できます.ストップストップの位置はATRに基づいており,各取引のリスク・リターン比率を制御できます.
トレンド追跡
ATRの移動ストップラインは,短期的な値引きの時にさえ,トレンドを追跡し,オフに触発されず,誤った信号を減らすことができる.
パラメータ最適化空間
T3平均周期とATR周期は,異なる市場に対応したパラメータを調整し,戦略の安定性を高めるために最適化することができます.
リスク分析
突破するリスク
激情が発生した場合,価格がストレートにストップラインを突破して損失を引き起こす可能性があります.ATR周期とストップ距離を適切に拡張して緩和することができます.
トレンド反転リスク
トレンド反転時に,価格が移動止損線を横切ると損失が生じることがあります.他の指標と組み合わせてトレンドを判断し,反転点の近くで取引を避けることができます.
パラメータ最適化のリスク
パラメータ最適化は,豊富な歴史的データによるサポートを必要とし,過最適化のリスクがある.複数の市場,複数の時間周期の組み合わせによる最適化パラメータを採用すべきであり,単一のデータセットに依存することはできない.
最適化の方向
-
異なるT3平均周期パラメータをテストし,感度と安定性をバランスする最適なパラメータの組み合わせを見つける
-
ATRサイクルパラメータをテストし,リスク管理とトレンド獲得の最適なバランスを探す
-
RSI,MACDなどの指標を組み合わせて,トレンドの逆転点の誤った取引を避ける
-
最適なパラメータを機械学習で訓練し,人工最適化の限界を低減する
-
ポジション管理戦略の強化とリスク管理の強化
要約する
この戦略は,T3平均線とATR指標の優位性を統合し,価格の変化に迅速に反応し,リスクを制御することができます.パラメータを最適化し,他の指標と組み合わせることで,戦略の安定性と取引効率をさらに高めることができます.しかし,トレーダーは,反転と突破のリスクを注意して,反測結果に過度に依存することを避ける必要があります.
- 1