ダブルEMA移動平均とATRインジケーターを使用したトレンドフォロー戦略

概要
この戦略は,二重EMA均線が金叉多多,死叉空のクラシックなトレンドをフォローする戦略を利用し,ATR指数とADX指数を使って追加のフィルタリングを行い,強いトレンドの時に追跡し,震動の時にリスクを制御する.
戦略原則
この戦略は主に以下の点に基づいています.
-
より短い8周期EMA平均線とより長い20周期EMA平均線を用いて金叉と死叉の信号を形成する.EMA平均線はそれ自体が傾向に従う性質を有する.
-
ATR指標は,最近の波動幅を反映している.ATR指標の正規化により,EMA均線交差のフィルタリング条件を動的に調整することができ,強烈なトレンドを追跡する際に要求を低下させ,震動的な状況でフィルタリング要求を高め,リスクを制御することができる.
-
ADX指標はトレンドの強さを判断する.ADX値が30以上になると,強いトレンドが発生したと考えられ,その時点で,時宜に損保を停止する.
-
牛市では金叉が多し,熊市では死叉が空きをする.
-
取引量フィルターで,取引量が増えると入場します.
-
ドル指数は,ドルが強くなると,ストープ・ペードやストップ・アップ幅が拡大する.
-
超トレンド指数と組み合わせて,市場全体の動きを判断し,空調のタイミングを判断する.
この戦略は,トレンド指数と震動指数の完全な組み合わせで,動的にパラメータを調整し,トレンドを追跡しながらリスクを制御することができます.
戦略的優位性
-
双EMA均線システムを使用してトレンド判断し,EMAは滑らかであり,偽突破を効果的にフィルターすることができる.
-
ATR指標はEMA均線交差フィルタリング条件を動的に調整し,戦略を異なる市場環境に柔軟に適応させることができる.
-
ADX指数と取引量は,震動の状況で被套を避けるための補助判断指標として用いられる.
-
ドル指数と超トレンド指数で大きなトレンドを判断し,意思決定の正確さを向上させる.
-
リスク管理のパラメータは,ドルが強くなると自動的に調整され,ドルが強くなるとストップ・ローズとストップ・アップ幅が拡大されます.
-
シンプルで直観的な金叉死叉取引シグナルとストップ・ストップ・ストップ戦略を使用して,容易に実現し,反省する.
戦略リスク
-
二重EMA均線システムは,トレンドの臨界点判断の遅れがあることを排除する.
-
ATRパラメータの選択を間違えた場合,極端に過激に保守的になる可能性があります.
-
ADX指標のパラメータは最適化が必要で,ADX高点を不適切に選択するとトレンドを逃す可能性があります.
-
ドル指数と超トレンド指数では誤差があるかもしれない.
-
ストップ幅が小さすぎると損失が増加し,幅が広い場合のストップ幅は容易に落とし込まれる.
思考を最適化する
-
MACDなどの他の指標と組み合わせてトレンドの臨界点を判断することも考えられます.
-
ATRのパラメータ空間を,より多くの歴史データを使って訓練し,最適なパラメータ範囲を見つける.
-
異なるADXパラメータをテストし,ADX高点判断を最適化する.
-
ドル指数や市場全体の動きを判断する変数を追加する.
-
測定データに基づいて最適の止損幅を計算する.
-
移動停止または振動停止に変更することを考慮することができます.
-
ポジション開設のサイズと保持周期の最適化を継続する.
要約する
この戦略は,クラシックな二重EMA均線システムと複数の補助指標を統合し,パラメータの自動最適化により,より完全なトレンドフォロー戦略を実現する. 市場環境の変化に柔軟に適応し,トレンドを追跡しながらリスクを制御することができる.しかし,より良い安定した収益を得るため,止損と指標のパラメータに対してさらなるテストと最適化が必要である.この戦略は,アイデアを参考にして改善する価値がある.
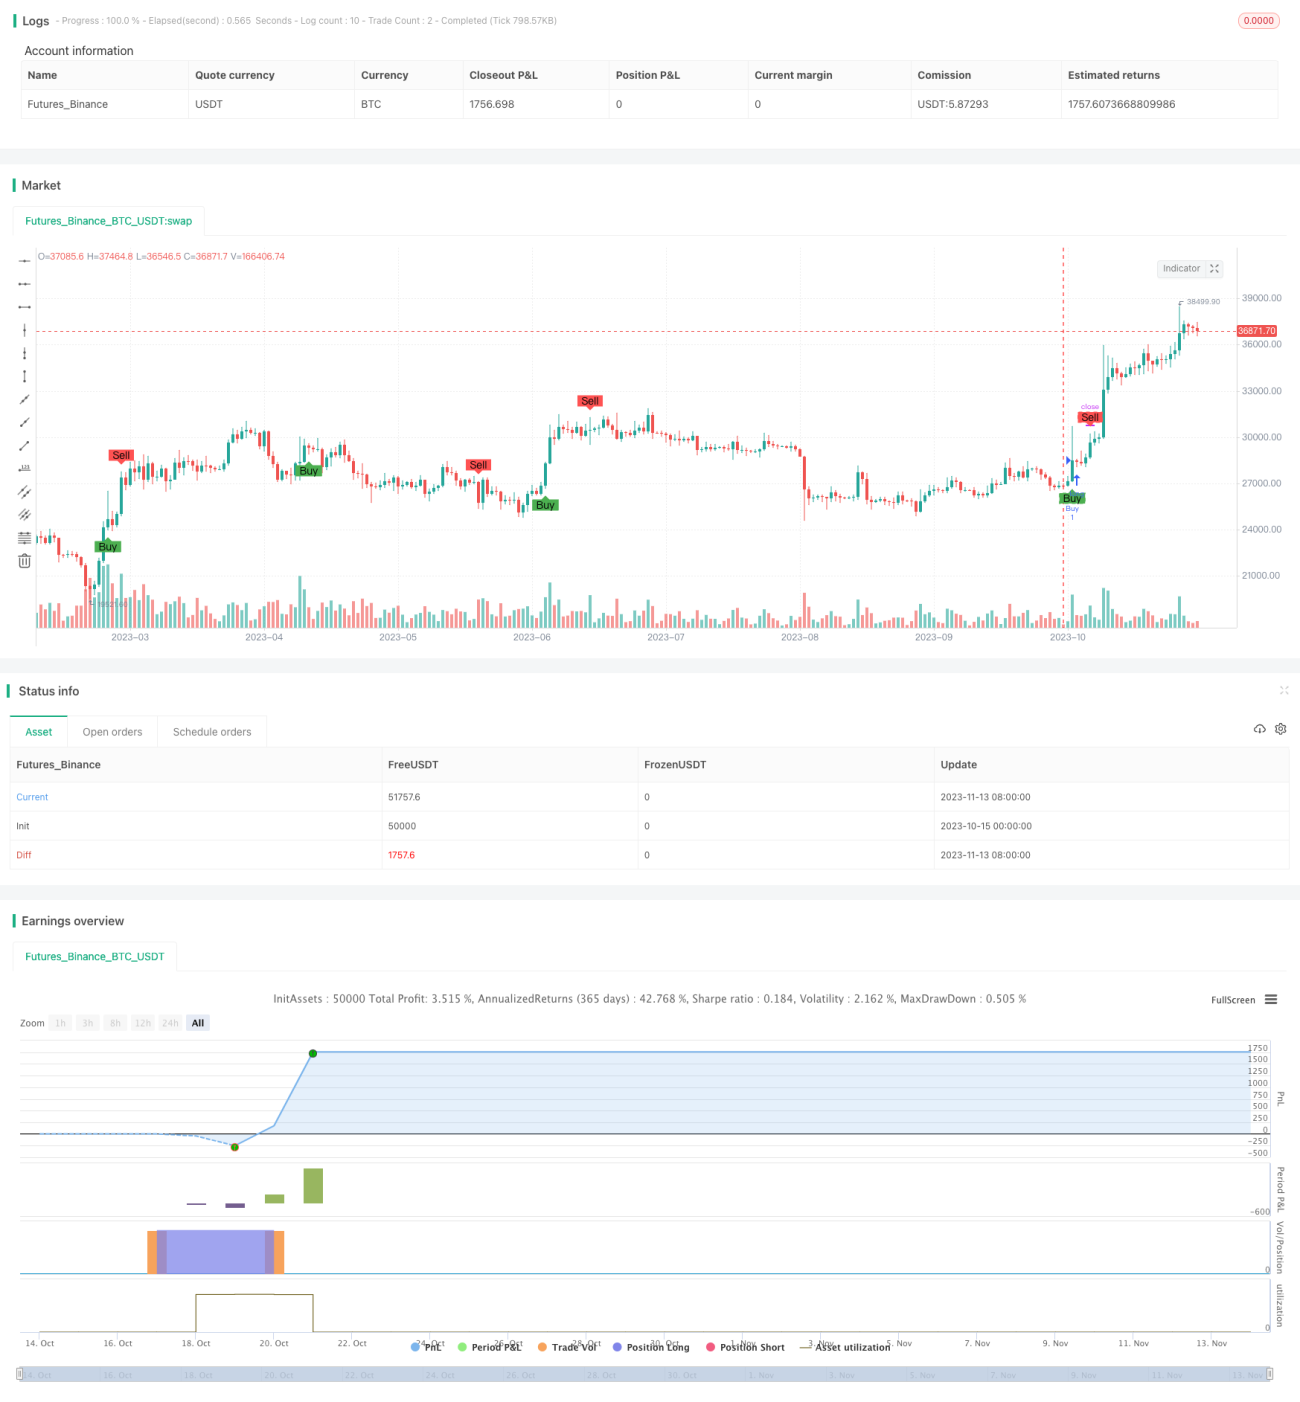
/*backtest
start: 2023-10-15 00:00:00
end: 2023-11-14 00:00:00
period: 1d
basePeriod: 1h
exchanges: [{"eid":"Futures_Binance","currency":"BTC_USDT"}]
*/

//@version=5
strategy("Refactored Advanced EMA Cross with Normalized ATR Filter, Controlling ADX", shorttitle="ALP V5", overlay=true)

// Initialize variables to track if a buy order has been placed and number of periods since the last buy- 1