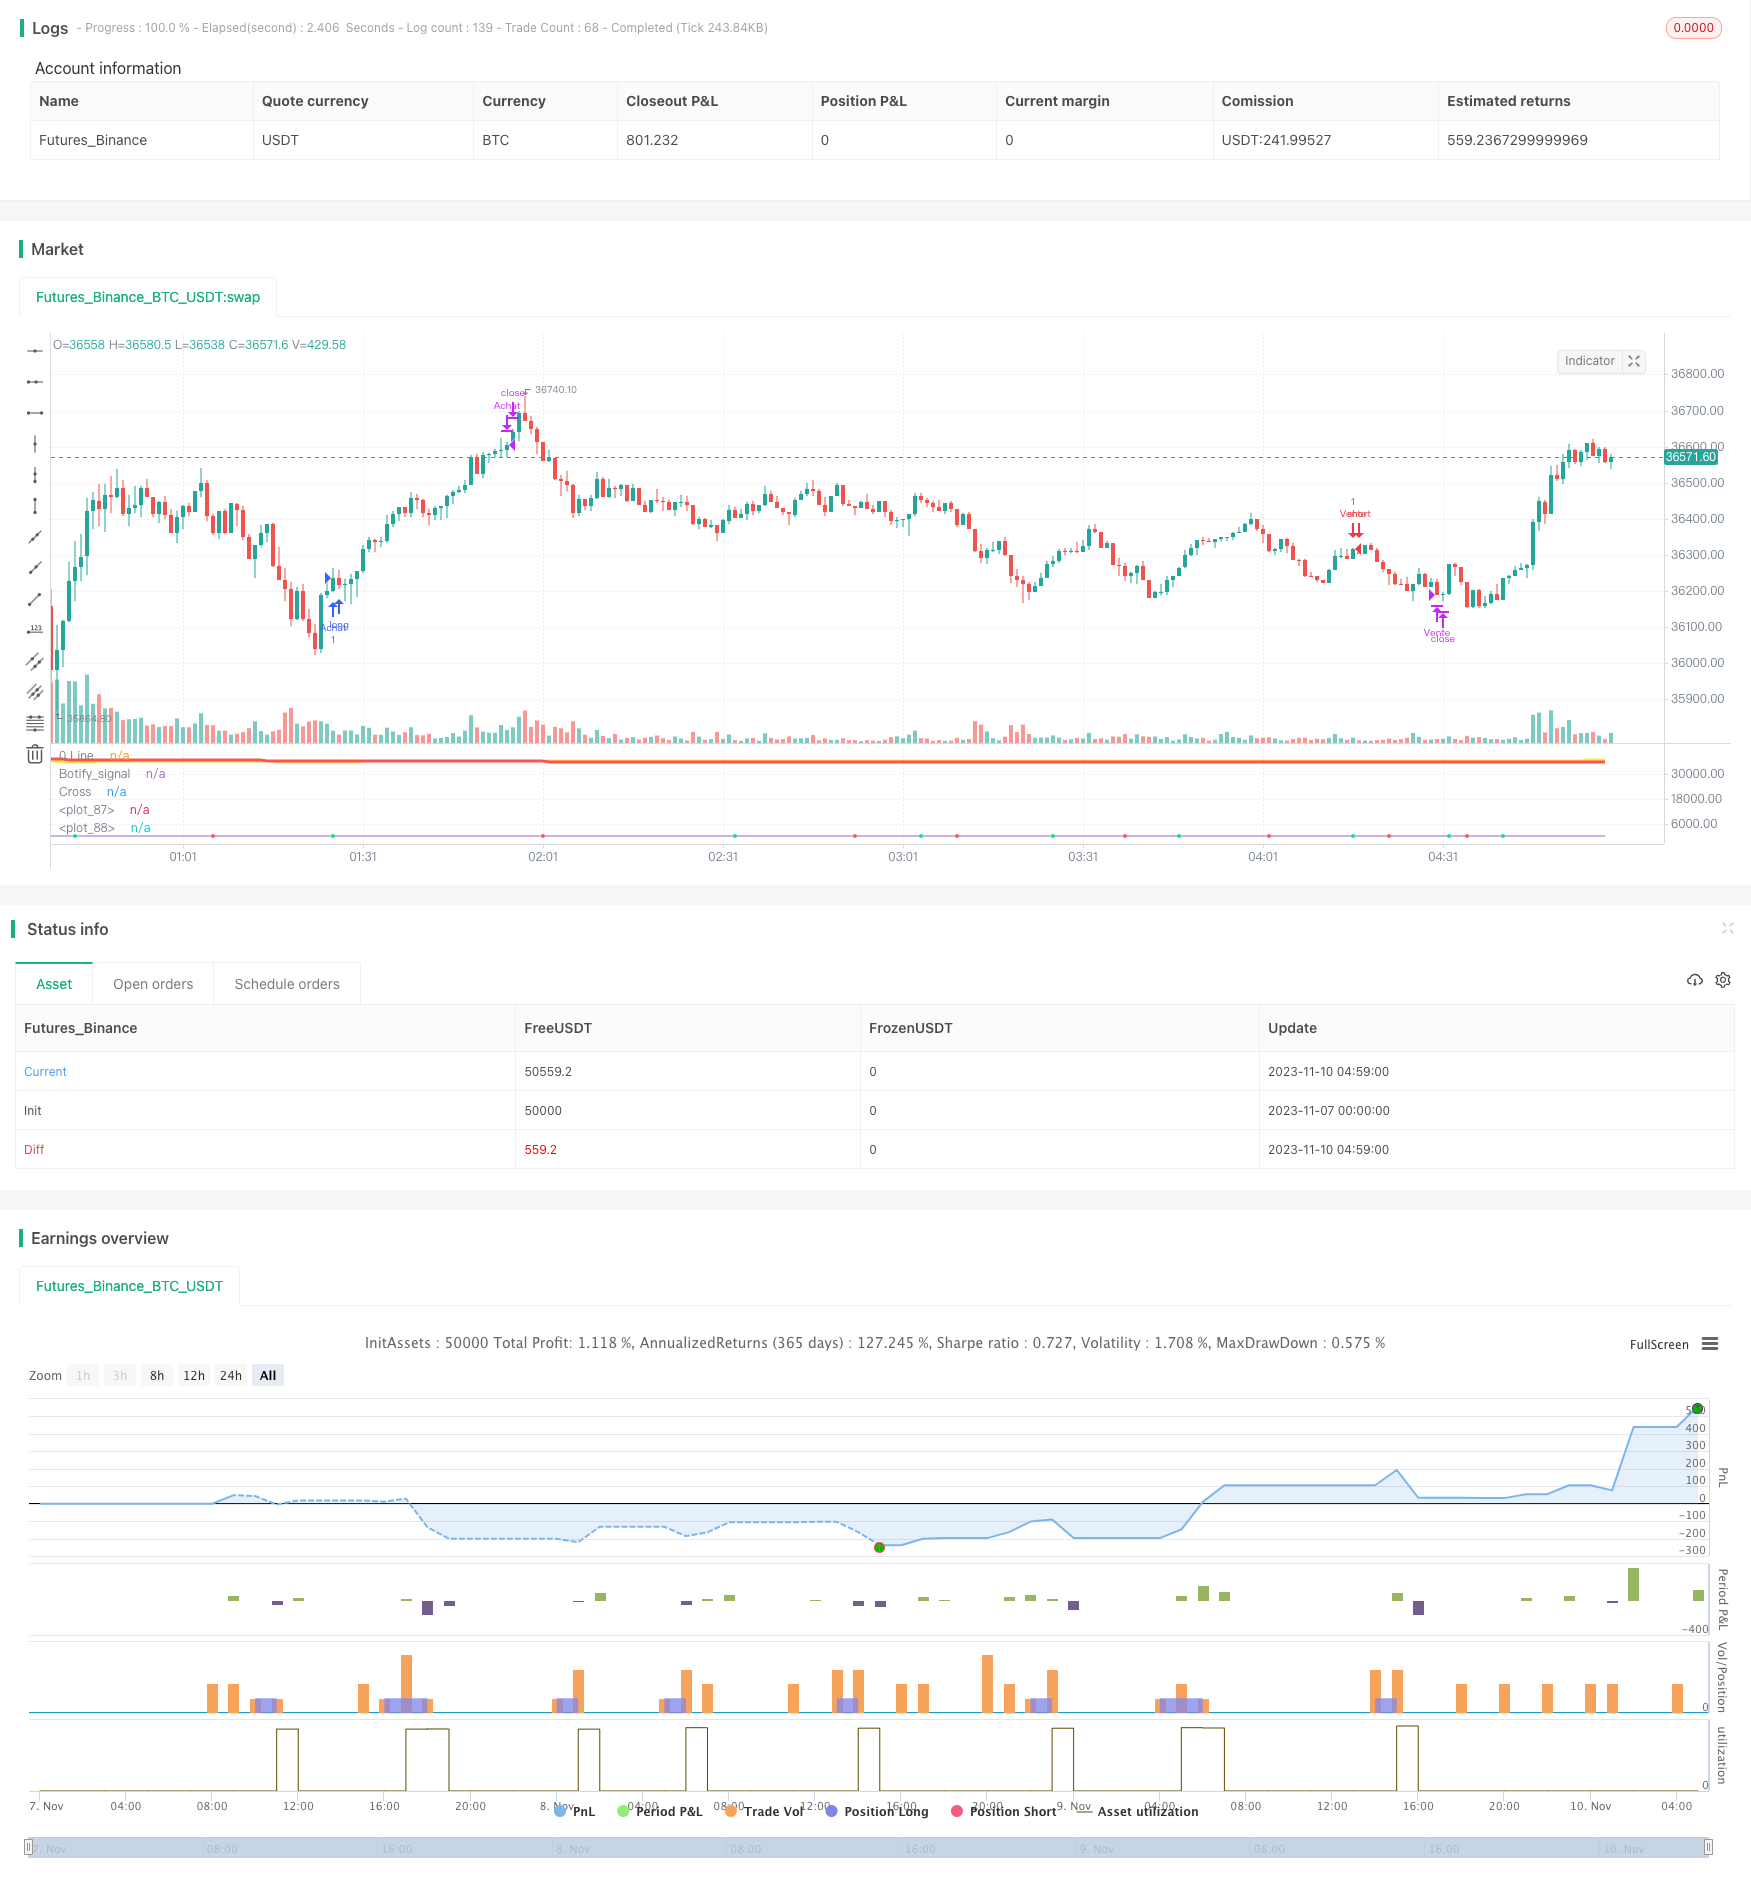
移動平均とMACD指標に基づく定量取引戦略

概要
この戦略は,平均線とMACD指標を組み合わせてトレンドを判断し,取引信号を発信し,典型的なトレンド追跡戦略である.それは,2つの異なる周期のZLSMA平均線を使用してトレンドの方向を判断し,さらにMACD指標の多空線交差を組み合わせて特定の買入と売却の信号を発信し,中長期トレンドを効果的に捕捉し,短期市場の騒音に惑わされないようにする.
戦略原則
この戦略は以下の部分から構成されています.
急速ZLSMA平均線と遅いZLSMA平均線:異なる周期のZLSMA平均線を比較することによって,全体的な傾向方向を判断する.急速線は32周期ZLSMAから構成され,遅い線は400周期ZLSMAから構成される.高速線で遅い線を横切るときは多形として見,逆に見空ける。
MACD指標:快線 ((12日EMA) を減算して遅線 ((26日EMA) を差離値MACDとすると,9日EMAで信号線が得られる.MACDの上を通るときは買い信号で,下を通るときは売り信号である.
取引シグナル:ZLSMA形状とMACD信号が同方向である場合にのみ,買ったり売ったりするシグナルを発出する.すなわち,多頭トレンド加えてMACD金叉は買ったり,空頭トレンド加えてMACDデッドフォークは売ったりする.
ストップ・ストップ・ストップ: この戦略は,ストップ・ストップ・ロジックにまだ加えられていないので,さらなる最適化が必要である.
上記の組み合わせは平均線を用いて大トレンドを判断し,MACDは入場タイミングを判断し,偽突破を効果的にフィルターし,短期市場の騒音に誤導されないようにする.
優位分析
この戦略の利点は以下の通りです.
トレンドキャプチャ:異なる周期平均線の組み合わせによってトレンド方向を判断し,順番に,中長線トレンドを効果的にキャプチャすることができます.
フィルタリングノイズ:MACD指標の適用は,短期市場のノイズをフィルタリングし,小範囲の振動に誤導されないようにする.
パラメータの調整:平均線周期とMACDパラメータはカスタマイズされ,異なる市場向けに最適化できます.
実行の簡単さ:指標は,一般的に使用される技術指標であり,組み合わせの論理はシンプルで明確で,理解し,実行するのが簡単です.
リスク管理: 明確なストップ・ロス・ストップ・ストップ戦略により,各取引のリスクと利益の比率をコントロールできます.
リスク分析
この戦略には以下のリスクもあります.
大トレンド判断の誤り:大トレンドの方向を誤って判断すると,すべての取引は失敗する可能性があります.
パラメータ最適化不適切:平均線パラメータとMACDパラメータを詳細にテストして最適化する必要があります.そうでなければ,効果は良くないかもしれません.
ストップ・ポイントの欠如: ストップ・ポイントが設定されていないため,過度の損失のリスクがあります.
利益の余地が限られている:トレンド追跡戦略として,各取引の利益の余地が限られており,より高い利益を得るには数量が必要である.
取引頻度過高:パラメータを正しく設定しない場合,取引頻度が過高になり,取引コストとスライドポイントコストが増加する可能性があります.
最適化の方向
この戦略は,以下の点でさらに最適化できます.
ストップ・ロスのメカニズムの加入:合理的なストップ・ロスを設定し,単一取引の最大損失を厳格に制御する.
最適化パラメータ: 平均線とMACDパラメータの最適な組み合わせを,反測と最適化によって見つけます.
取引頻度を下げる:トレンドが顕著である時にのみ取引シグナルを発信するようにパラメータを調整する.
他の要素との組み合わせ:トレンドとシグナルを確認するために,取引量の変化などの他の要素を追加できます.
入学時間を最適化:MACD指標の適用をさらに最適化して入学の正確性を向上させる.
多品種通用性:パラメータ最適化により,戦略を異なる品種に広く適用できるようにし,適用範囲を拡大する.
要約する
全体として,この戦略は,シンプルで効果的な均線とMACD指標の組み合わせによって,中長線のトレンドを捉えることができ,量化取引の基本戦略として使用できます.しかし,さらにパラメータを最適化し,リスクを制御し,他の要因と組み合わせて,より安定した取引効果を達成する必要があります.
/*backtest
start: 2023-11-07 00:00:00
end: 2023-11-10 05:00:00
period: 1m
basePeriod: 1m
exchanges: [{"eid":"Futures_Binance","currency":"BTC_USDT"}]
*/

// This source code is subject to the terms of the Mozilla Public License 2.0 at https://mozilla.org/MPL/2.0/
// © veryfid

//@version=5
strategy("Stratégie ZLSMA Bruno", shorttitle="Stratégie ZLSMA Bruno", overlay=false)

source = close
useCurrentRes = input(true, title="Use Current Chart Resolution?")
smd = input(true, title="Show MacD & Signal Line? Also Turn Off Dots Below")
sd = input(true, title="Show Dots When MacD Crosses Signal Line?")
sh = input(true, title="Show Histogram?")
macd_colorChange = input(true,title="Change MacD Line Color-Signal Line Cross?")
hist_colorChange = input(true,title="MacD Histogram 4 Colors?")

//res = useCurrentRes ? period : resCustom

fastLength = input(12),
slowLength=input(26)
signalLength=input(9)

fastMA = ta.ema(source, fastLength)
slowMA = ta.ema(source, slowLength)

macd = fastMA - slowMA
signal = ta.sma(macd, signalLength)
hist = macd - signal

outMacD =  macd
outSignal = signal
outHist =  hist

histA_IsUp = outHist > outHist[1] and outHist > 0
histA_IsDown = outHist < outHist[1] and outHist > 0
histB_IsDown = outHist < outHist[1] and outHist <= 0
histB_IsUp = outHist > outHist[1] and outHist <= 0

//MacD Color Definitions
macd_IsAbove = outMacD >= outSignal
macd_IsBelow = outMacD < outSignal

//plot_color = hist_colorChange ? histA_IsUp ? aqua : histA_IsDown ? blue : histB_IsDown ? red : histB_IsUp ? maroon :yellow :gray
macd_color = macd_colorChange ? macd_IsAbove ? color.lime : color.red : color.red
//signal_color = macd_colorChange ? macd_IsAbove ? yellow : yellow : lime

circleYPosition = outSignal

//plot(smd and outMacD ? outMacD : na, title="MACD", color=macd_color, linewidth=4)
//plot(smd and outSignal ? outSignal : na, title="Signal Line", color=signal_color, style=line ,linewidth=2)
//plot(sh and outHist ? outHist : na, title="Histogram", color=plot_color, style=histogram, linewidth=4)
plot(sd and ta.cross(outMacD, outSignal) ? circleYPosition : na, title="Cross", style=plot.style_circles, linewidth=4, color=macd_color)
hline(0, '0 Line', linestyle=hline.style_solid, linewidth=2, color=color.white)

// Paramètres de la ZLSMA
length = input(32, title="Longueur")
offset = input(0, title="Décalage")
src = input(close, title="Source")
lsma = ta.linreg(src, length, offset)
lsma2 = ta.linreg(lsma, length, offset)
eq = lsma - lsma2
zlsma = lsma + eq

length_slow = input(400, title="Longueur")
offset_slow = input(0, title="Décalage")
lsma_slow = ta.linreg(src, length_slow, offset_slow)
lsma2_slow = ta.linreg(lsma_slow, length_slow, offset_slow)
eq_slow = lsma_slow - lsma2_slow
zlsma_slow = lsma_slow + eq_slow

// Paramètres de la sensibilité
sensitivity = input(0.5, title="Sensibilité")

// Règles de trading
longCondition = zlsma < zlsma_slow and  zlsma_slow < zlsma_slow[1] and zlsma > zlsma[1] and ta.cross(outMacD, outSignal) and  macd_color == color.lime//ta.crossover(zlsma, close) and ta.crossover(zlsma, zlsma[1]) // Croisement vers le haut
shortCondition = zlsma > zlsma_slow and  zlsma_slow > zlsma_slow[1] and zlsma < zlsma[1] and ta.cross(outMacD, outSignal) and  macd_color == color.lime   //ta.crossunder(zlsma, close) and ta.crossunder(zlsma, zlsma[1]) // Croisement vers le bas

// Entrée en position
strategy.entry("Achat", strategy.long, when=longCondition)
strategy.entry("Vente", strategy.short, when=shortCondition)
botifySignalZLSMA = longCondition ? 1 : shortCondition ? -1 : 0
plot(botifySignalZLSMA, title='Botify_signal', display=display.none)
// Sortie de position
strategy.close("Achat", when=ta.crossunder(zlsma, close)) // Close the "Achat" position
strategy.close("Vente", when=ta.crossover(zlsma, close)) // Close the "Vente" position


// Tracé de la courbe ZLSMA
plot(zlsma, color=color.yellow, linewidth=3)
plot(zlsma_slow, color=color.red, linewidth=3)