ダブル移動平均クロスオーバーアロー戦略

1
Follow
1779
Followers
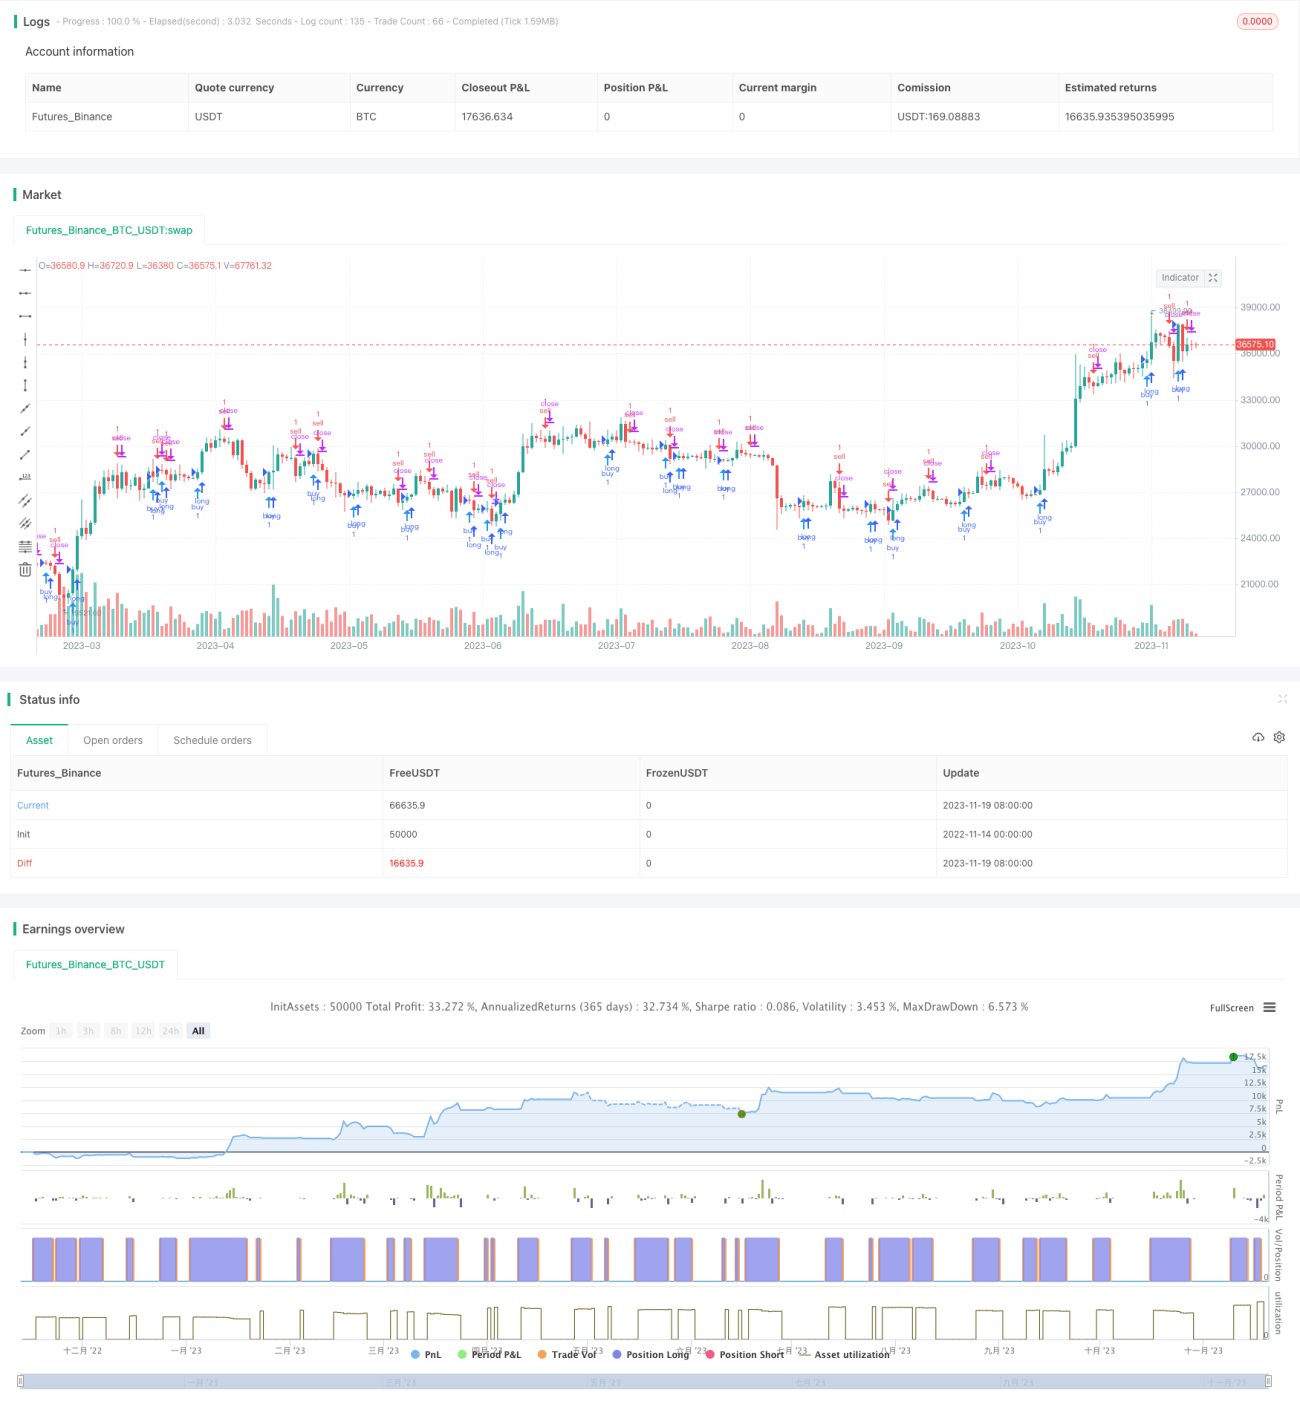
概要
この戦略は,MACD指標の双均線交差を計算することで,買入と売却のタイミングを判断する.これは,取引シグナルを提示するために,グラフに矢印の形を描画する.
原則
この戦略は,まず,速線 (EMA 12期),慢線 (EMA 26期) とMACDの差値を計算し,それから,速線と慢線の金叉死叉とMACDの差値の正負に基づいて,買入と売却のタイミングを判断する.
- 速線で遅線を穿越して (金叉) MACD差値で0を穿越すると買取信号として
- 速線下を通過して遅線 ((死叉) とMACD差値の下を通過して0で売り信号として
偽信号をフィルタリングするために,コードでは,前回のK線の信号状態も判断する.現在のK線が反転信号である場合にのみ,現在の信号がトリガーされる.
また,Kオンラインで購入・売却のタイミングを提示する矢印の図も描かれています.
利点
この戦略の利点は以下の通りです.
- 双均線交差判断を使用し,市場騒音を効果的にフィルターし,トレンドを識別します.
- MACD差値判断と組み合わせることで,欠落や誤判を回避できます.
- 矢印の提示で買い物や取引のタイミングを把握する.
- 規則はシンプルで明快で,理解し複製しやすい.
リスクと解決策
この戦略にはいくつかのリスクがあります.
- 双均線交差は偽信号を生じやすく,過剰取引を引き起こす可能性があります.均線パラメータを適切に調整したり,偽信号を減らすために他のフィルタリング条件を追加したりできます.
- トレンドの揺れが判定できない場合,損失が発生する可能性があります. トレンド指標であるADXと組み合わせることで,この状況を回避できます.
- 固定的な買取条件は,戦略を機械化し,市場の変化に適応できない. 機械学習などの自己適応方法を試して最適化することができます.
最適化の方向
この戦略は以下の方向から最適化できます.
- 異なるパラメータの組み合わせをテストし,最適のFast, Slow, MACDパラメータを見つけます.
- 入場条件を追加し,取引量突破で信号をフィルターする
- 単一損失を抑えるため,減損メカニズムを増やす.
- VIXなどの変動率指標と組み合わせたリスク偏好の判断
- 固定規則の代わりに機械学習モデルを試し,戦略の自主的な最適化を実現します.
要約する
この二均線交差矢印策は,全体的に比較的シンプルで実用的で,二均線交差判断とMACD差値フィルタによって,中長線傾向の買出点を識別し,価格転換を逃さないようにすることができる.矢印提示は,操作をより明確に明確にする.後期には,パラメータ最適化,フィルタ条件の追加などによって,戦略の安定性と収益率をさらに高めることができる.
Source
Pine
/*backtest
start: 2022-11-14 00:00:00
end: 2023-11-20 00:00:00
period: 1d
basePeriod: 1h
exchanges: [{"eid":"Futures_Binance","currency":"BTC_USDT"}]
*/

//@version=3
//Daniels stolen code
strategy(shorttitle="Daniels Stolen Code", title="Daniels Stolen Code", overlay=true, calc_on_order_fills=true, pyramiding=0)
Related strategies
Comment
All comments (0)
No data
- 1