トレンドブレイクスルーダブル移動平均フィルター戦略

概要
これは,均線とブリン通路を利用してトレンド判断を行い,フィルターとストップの原理を突破する戦略である.それは,トレンドが変化する時に適切な信号を捕捉し,双均線フィルターによって誤信号を軽減し,リスクを制御するためにストップを設定することができる.
戦略原則
この戦略は以下の部分から構成されています.
-
トレンド判断:MACDを使用して価格のトレンドを判断し,多頭と空頭のトレンドを区別する.
-
範囲フィルタリング:ブリンチャネルを使用して価格変動の範囲を判断し,範囲を突破しない信号をフィルタリングする.
-
双均線確認:急速EMAと遅いEMAからなる双均線で,トレンドシグナルを確認する. 購入シグナルが生成されるのは,急速EMA>遅いEMAである場合にのみである.
-
止損機構:止損点を設定し,価格が不利な方向に止損点を突破したときに平仓を止める.
信号の判断の論理は次のとおりです.
- MACDは上昇傾向にあると判断した.
- 価格がブリン・チャネルを突破
- 速度のEMAが遅さのEMAより高い
この3つの条件が同時に満たされると,購入シグナルが生成されます.
平仓の論理は,2種類に分けられる. ストップ・ピッチ・ピッチ・ポジションとストップ・ピッチ・ポジションである. ストップ・ポイントは入札価格に一定比率を掛け,ストップ・ポイントは入札価格に一定比率を掛けである. 価格がいずれかのポイントを突破したときの平仓である.
優位分析
この戦略の利点は以下の通りです.
- 市場が変化するにつれて,市場が変化するにつれて,市場が変化するにつれて,
- 双均線フィルターによる誤信号の改善.
- 損失防止メカニズムは,単一損失を効果的に制御する.
- パラメータ最適化スペースは広いので,最適状態に調整できます。
リスク分析
この戦略にはいくつかのリスクがあります.
- 震災時の誤った信号は,損害を招く可能性があります.
- ストップポイントを正しく設定しないことで,不必要な損失が引き起こされる可能性があります.
- 誤ったパラメータは,戦略の効果を損なう可能性があります.
これらのリスクに対して,最適化パラメータ,停止位置の調整などによって最適化および改善を行うことができます.
最適化の方向
この戦略は以下の方向から最適化できます.
- 双均線の長さを調整し,最適なパラメータの組み合わせを探します.
- トラッキング・ストップ,振動・ストップなど,さまざまなストップ方法をテストする.
- MACDパラメータをテストし,最適パラメータを探します.
- 機械学習によるパラメータの自動最適化.
- 追加条件フィルタリング信号
異なるパラメータ設定をテストし,収益率とシャープ比率を評価することで,この戦略の最適な状態を見つけることができます.
要約する
これは,トレンド判断,範囲フィルター,双均線確認,および停止思考を利用した定量化戦略である. これは,トレンドの方向を効果的に判断し,利潤の最大化とリスク管理の間のバランスをとることができる. この戦略には,パラメータ最適化および機械学習などの方法によって,改善の余地があり,よりよい効果が得られる.
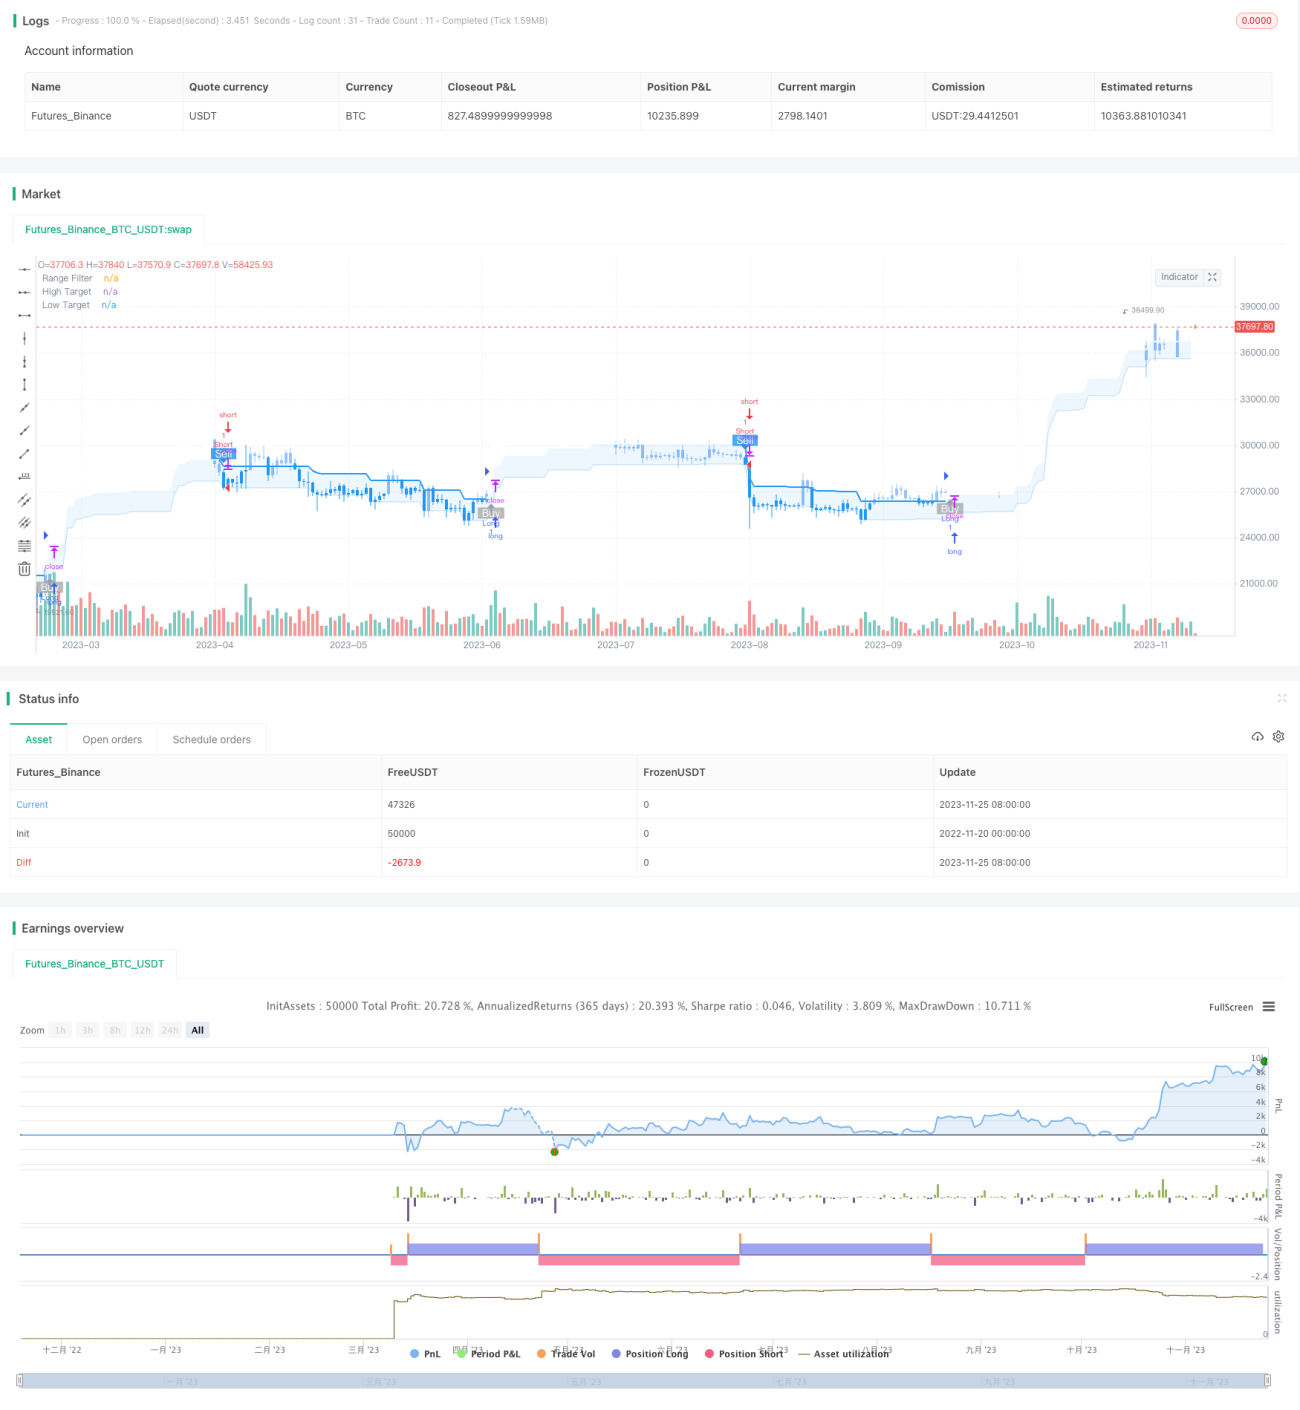
/*backtest
start: 2022-11-20 00:00:00
end: 2023-11-26 00:00:00
period: 1d
basePeriod: 1h
exchanges: [{"eid":"Futures_Binance","currency":"BTC_USDT"}]
*/

//@version=5
strategy(title="Range Filter Buy and Sell Strategies", shorttitle="Range Filter Strategies", overlay=true,pyramiding = 5)

// Original Script > @DonovanWall- 1