TFOとATRに基づくトレンドフォローストップロス戦略

概要
この戦略は,ドクター・ジョン・エラーズのトレンド・フレックス・オシレータ (Trend Flex Oscillator,TFO) と平均真の波動範囲 (Average True Range,ATR) をベースに設計されたトレンド・フォロー・ストップ・戦略である.これは,オーバーソールド後の価格が逆転したときにオーバーソールドのポジションを開く多頭市場に適用される.これは,通常,数日のうちにポジションを平らげ,熊市に捕らわれない限り,その場合,ポジションを維持する.この戦略は,簡単な反測によって設定可能なパラメータを調整するが,完全には反測の結果を信じてはならない.
戦略原則
この戦略は,TFOとATRの2つの指標を組み合わせて,買入条件を満たす場合の多仓を開き,売出条件を満たす場合の平仓を行う.
購入条件:TFOが特定の<unk>値を下回ったとき (((表示過空頭),および上方のK線のTFOが現在のK線を下回ったとき (((表示TFO反転上昇),またATRが設定された波動の<unk>値を超えたとき (((表示市場の波動が増加),この3つの条件を満たせば多仓を開く.
平仓条件:TFOが某の<unk>値 ((表示過多頭) よりも高く,ATRが設定した<unk>値より高い場合に,条件を満たすと,すべての多仓を平仓する.さらに,この戦略は,追跡ストップを設定し,価格が設定された追跡ストップ・損失価格を下回ると,すべての多仓を平衡する.ユーザーは,戦略が指標信号に従って平仓することを選択することができます.または,価格平仓に従って止まるだけです.
この戦略は,最大15の多頭ポジションを同時に開くことができる.そのパラメータは,異なる時間周期に適用して調整することができます.
戦略的優位性
-
トレンドと波動度を組み合わせて市場の方向を判断し,比較的安定である。TFOは突破トレンドの早期信号を捉え,ATRは市場の波動が増加するタイミングを把握することができる。
-
調整可能な買取参数と止損参数が設定され,操作が柔軟である. ユーザーは市場に応じて参数調整して最適化することができる.
-
ストップ・ロスの機能が内蔵され,極端な状況での損失を減らすことができます.ストップ・ロスの戦略は,量化取引の非常に重要な環です.
-
ポジションの追加開設と部分平仓をサポートし,ポジションを増やすことで利益を増やすことができます.
戦略リスク
-
この戦略は,空白ではなく,多額の利益を得ることなく,下落の市場から利益を得ることができません. 悲惨な熊市が起こった場合,巨額の損失が発生する可能性があります.
-
パラメータ設定が不適切である場合,過剰な取引や空売りが起こりうる.最適なパラメータの組み合わせを見つけるために,繰り返しテストが必要である.
-
極端な状況では,ストップ・ロスは効果がなく,大きな損失を防ぐことができません.これは,すべてのストップ・ロスの戦略が直面する可能性がある問題です.
-
予想は,実際の取引を完全には反映していないので,実際の取引結果には一定偏差がある.
戦略の最適化
-
販売条件に移動止損ラインを追加することは考えられます.これは,戦略が早期に止損し,下行リスクを効果的に制御できるようにします.
-
空調の仕組みを拡張して,TFOが逆転下落しATRが十分に大きいときに空調を打つことで,戦略が空頭市場に適用できる.
-
取引量の変化など,より多くのフィルタリング条件を追加して,異常な行動が戦略に与える影響を減らすことができます.
-
異なる時間周期のパラメータ設定と反測結果をテストして,最適な周期とパラメータの組み合わせを見つけることができます.
要約する
この戦略は,トレンド分析と波動度モニタリングの優位性を統合し,TFOとATRの指標の組み合わせによって市場の方向性を判断します.追加開場,部分平置,移動停止などの仕組みを設定し,利益を拡大し,リスクを制御し,多頭行情に適しています.さらに,拡張可能な最適化スペースがあり,より多くの指標フィルターとパラメータ調整を加えることで,戦略のパフォーマンスをさらに改善することができます.
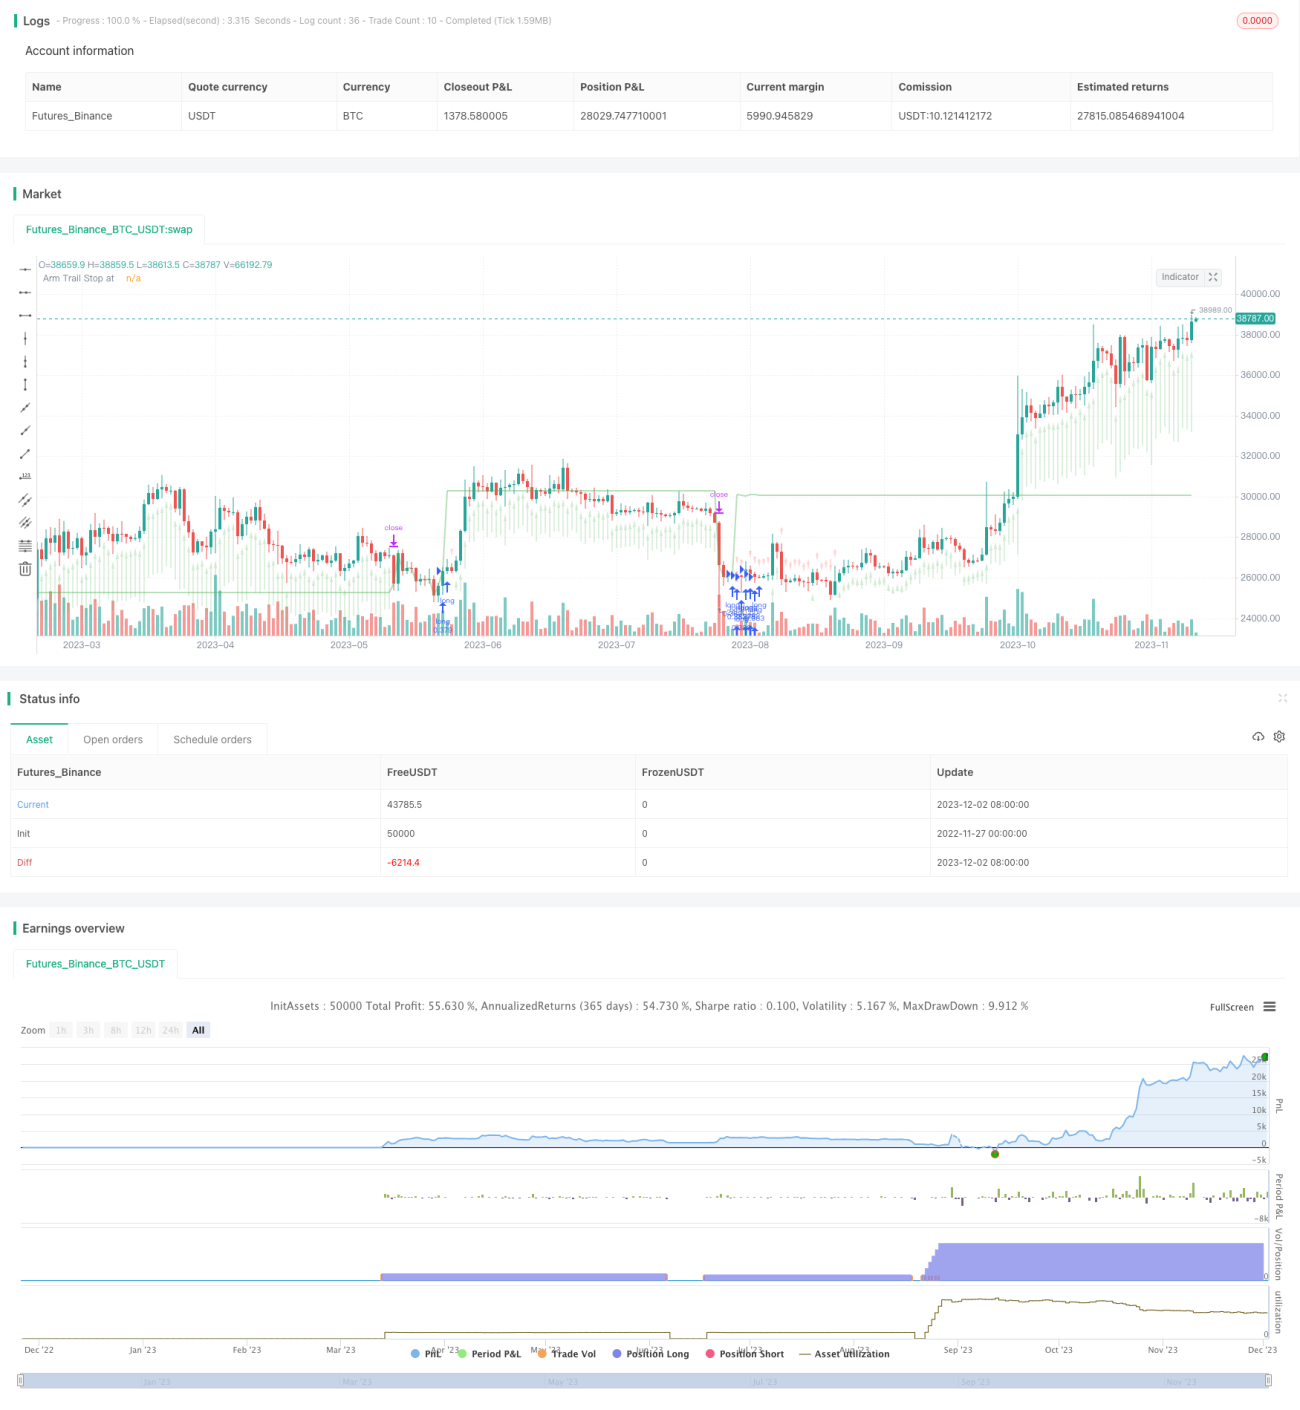
/*backtest
start: 2022-11-27 00:00:00
end: 2023-12-03 00:00:00
period: 1d
basePeriod: 1h
exchanges: [{"eid":"Futures_Binance","currency":"BTC_USDT"}]
*/

// This source code is subject to the terms of the Mozilla Public License 2.0 at https://mozilla.org/MPL/2.0/
// © Chart0bserver
//
// Open Source attributions:- 1