マルチファクターRSI反転戦略

1
Follow
1779
Followers
概要
この戦略は,RSI指標を用いて超買い超売り現象を識別し,MACD,ストキャスティック指標などの多種多様な補助因子と組み合わせて介入する.この戦略は,短期的な逆転の機会を捕捉することを目的として,逆転戦略に属している.
戦略原則
この戦略は,市場が超買または超売り状態にあるかどうかを判断するために,主にRSI指標を使用します. RSI指標が設定された超買ラインを超えると,市場が超買状態にある可能性があることを示すとき,戦略は空白を選択します. RSI指標が設定された超売りラインを下回ると,市場が超売り状態にある可能性があることを示すとき,戦略は,そのとき多額の選択を行います.
さらに,戦略はMACD,Stochasticなどの複数の補助因子を導入している.これらの補助因子の役割は,発生する可能性のある偽陽性取引信号をフィルターするものである.RSI指標が信号を発し,補助因子がその信号をサポートしている場合にのみ,戦略は本当の取引行動を起こす.この複数の要因の組み合わせは,戦略信号の信頼性を高め,その結果,戦略の安定性を高めることができる.
優位分析
この戦略の最大の利点は,捕捉効率が高く,マルチファクトル検証が信号品質を向上させるという点にある.具体的には,主に以下の側面に表れている.
- RSI指数は,市場体制を識別する能力が強く,過剰買い過剰販売を効果的に識別することができる.
- 複数の補助ツールによる多要素検証により,信号の質が向上し,多くの偽陽性結果がフィルターされました.
- 戦略はパラメータに敏感で,簡単に最適化できます.
リスクと解決策
この戦略にはリスクもありますが,主に2つの側面に重点を置いています.
- 逆転失敗のリスク。逆転信号自体は,個々の逆転失敗の確率を排除しない統計的ブレイジングの機会に依存している。ポジションを下げるか,またはストップ損失を設定することによってリスクを制御することができます。
- 多頭情勢下での損失リスク。戦略全体では逆市操縦が主であり,多頭情勢下では必然的に一定損失が発生する。これは,大きな傾向を正確に判断し,必要に応じて人工介入によって不利な市場環境を跳び越す必要がある。
最適化の方向
この戦略は,次の側面から改善する必要がある.
- 異なる品種をテストし,最適なパラメータの組み合わせを探します. 策略はパラメータに敏感ではありませんが,異なる品種に対して最適なパラメータを探すことを推奨します.
- 適応退出メカニズムの追加. 動的ストップ,時間退出などの方法を追加して,戦略を市場の変化に適応させる方法をテストすることができます.
- 機械学習アルゴリズムを導入する. 戦略の勝利率を向上させるため,逆転の成功率を判断するモデル学習を試みることができる.
要約する
この戦略は,全体として,ショートライン反転戦略である. RSI指標を使用して,超買い超売りを判断する能力を利用し,同時に,複数の補助ツールを使用して,複数の要因を検証し,その結果,信号の質を向上させる. この戦略は,捕捉効率が高く,安定性が優れている.
Source
Pine
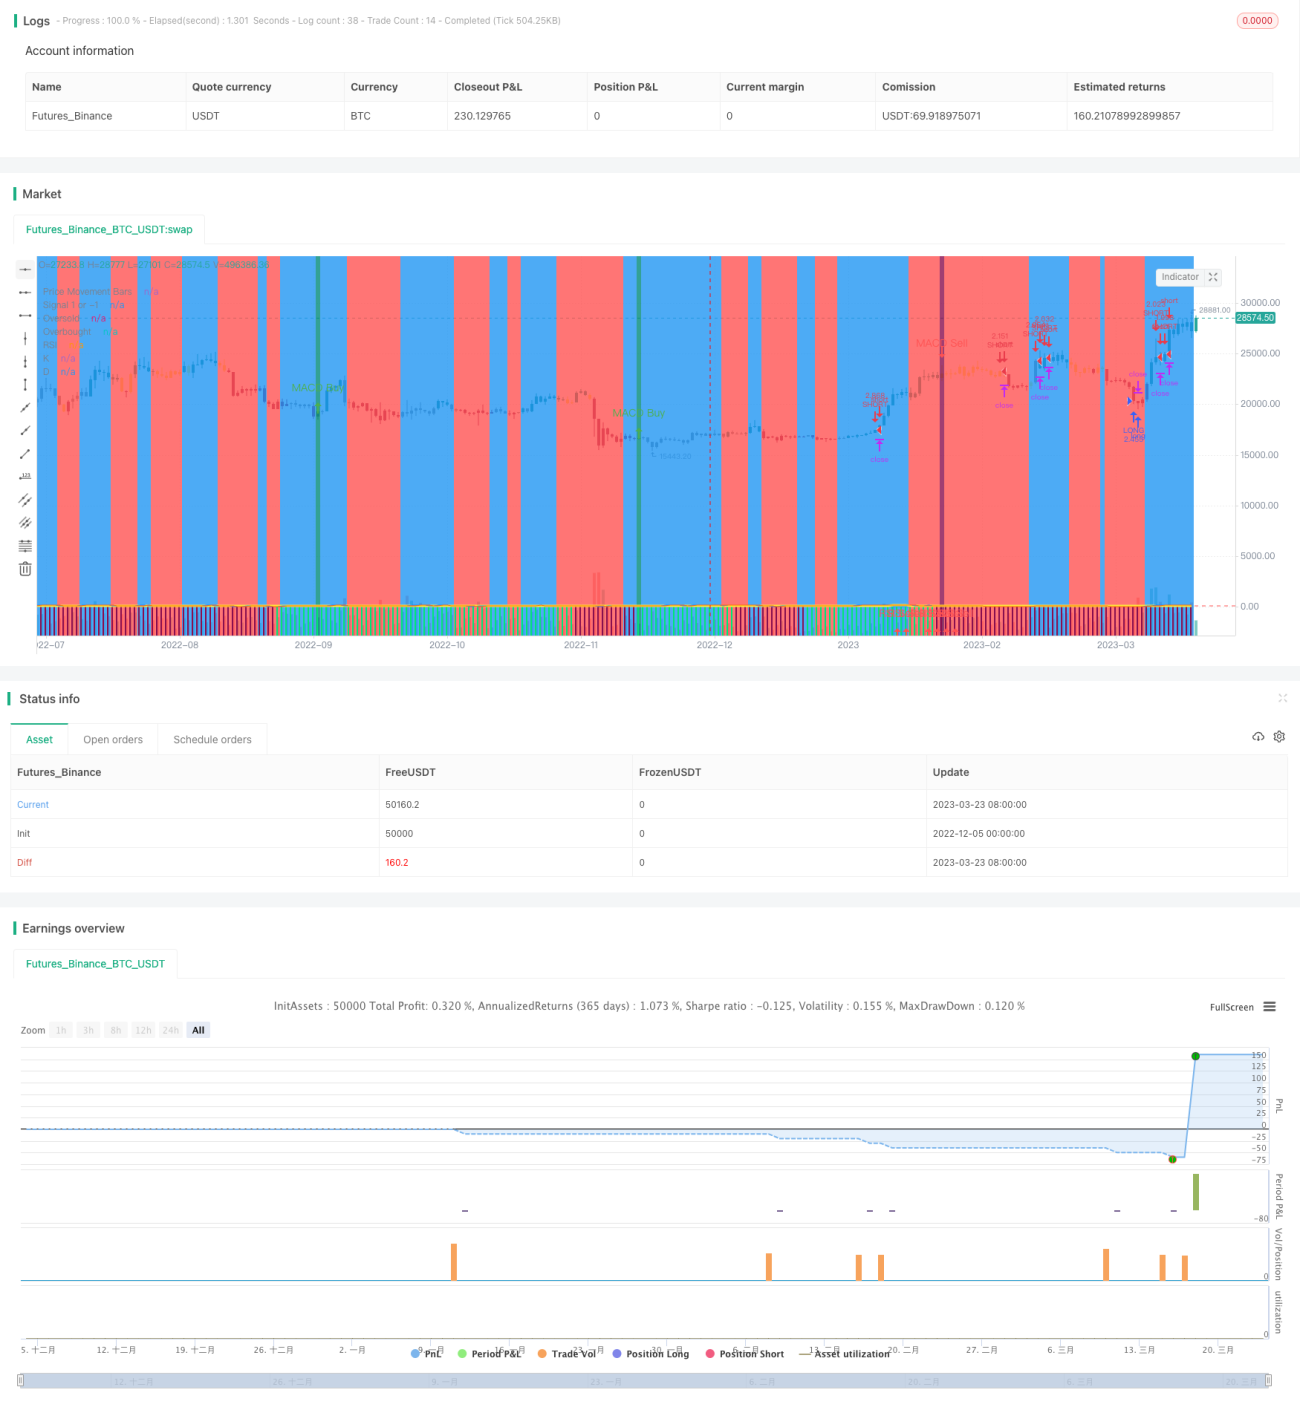
/*backtest
start: 2022-12-05 00:00:00
end: 2023-03-24 00:00:00
period: 1d
basePeriod: 1h
exchanges: [{"eid":"Futures_Binance","currency":"BTC_USDT"}]
*/

// This source code is subject to the terms of the Mozilla Public License 2.0 at https://mozilla.org/MPL/2.0/
//@version=4

strategy(shorttitle='Ain1',title='All in One Strategy', overlay=true, initial_capital = 1000, process_orders_on_close=true, default_qty_type = strategy.percent_of_equity, default_qty_value = 100, commission_type=strategy.commission.percent, commission_value=0.18, calc_on_every_tick=true)Strategy parameters
Related strategies
Comment
All comments (0)
No data
- 1