タートルブレイクアウトリトレースメント適応型取引戦略

概要
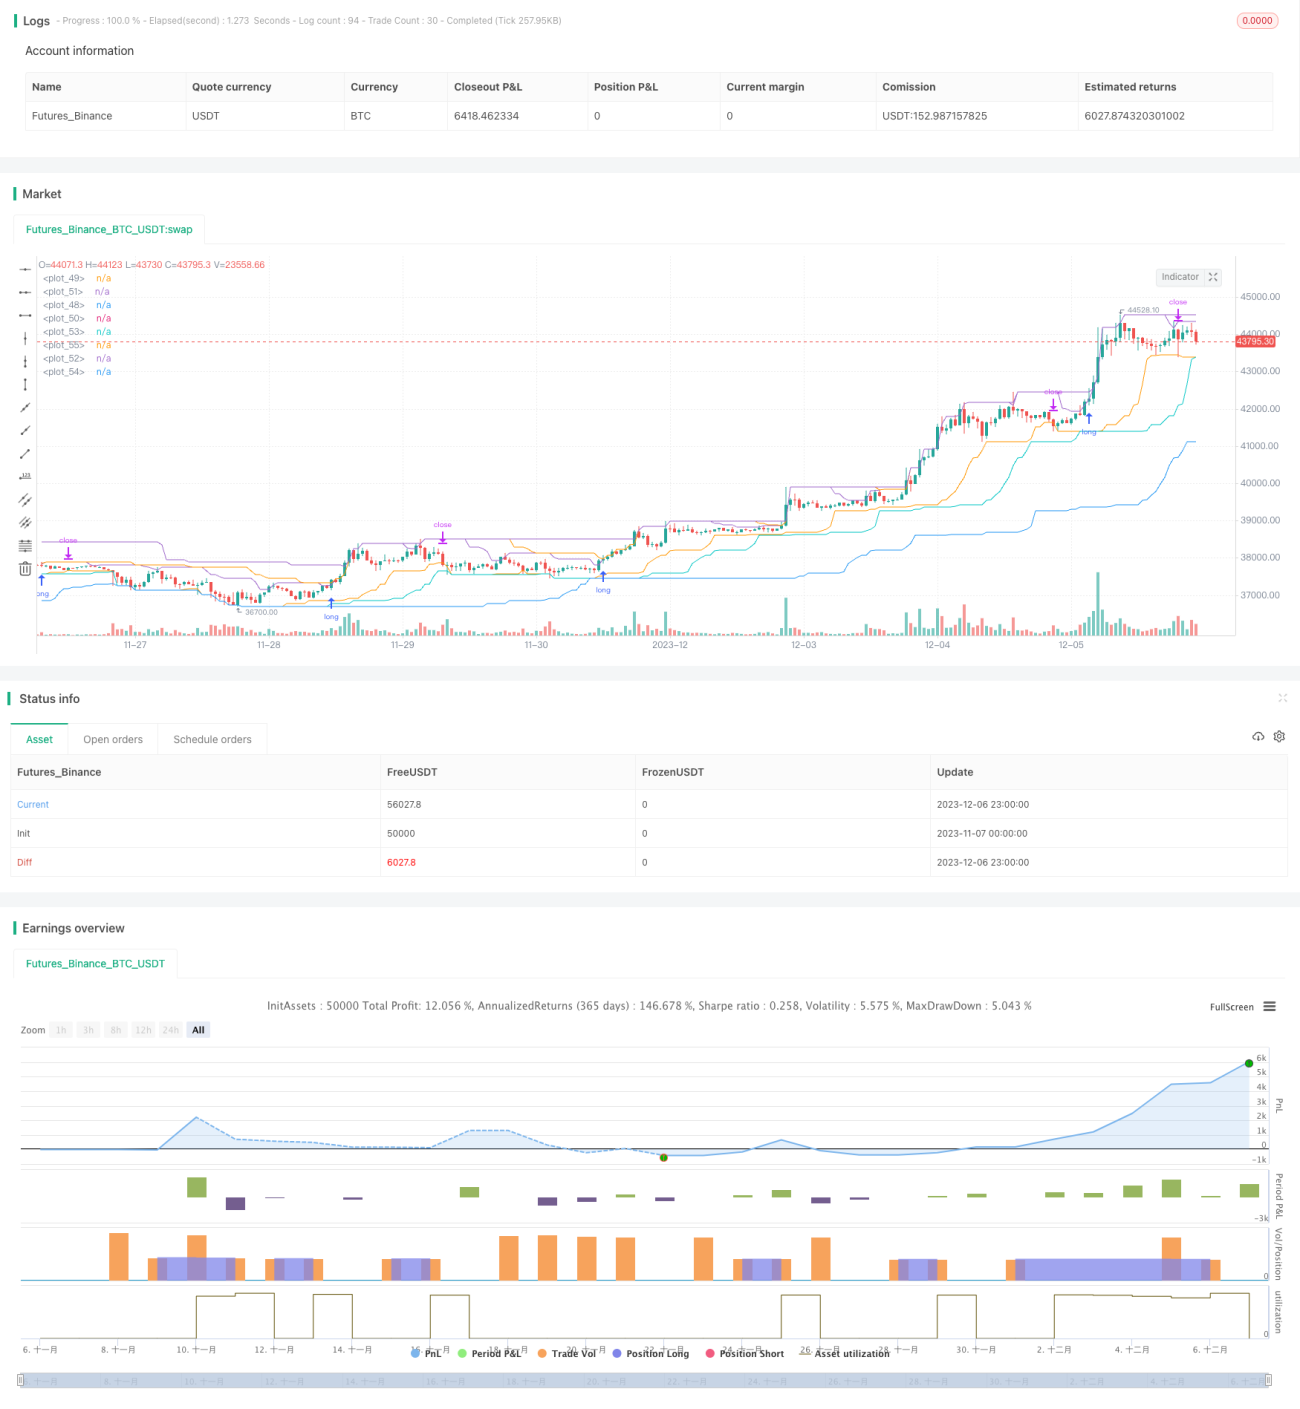
この戦略は主にトレンドブレイク原理に基づいており,チャネルブレイクの方法と組み合わせて,快線・スローライン・デュアルレールブレイクを使用してトレンドの方向を判断する.この戦略は,突破エントリーと撤回エクジットの二重保護を同時に備えており,市場の突破に効果的に対応できる.この戦略の最大の利点は,アカウントの撤回をリアルタイムで監視でき,撤回が一定比率を超えると,ポジションの規模を主動的に削減するということである.これは,戦略が市場リスクとアカウントのリスク抵抗力を効果的に制御できるようにする.
戦略原則
-
快慢線双線:それぞれ快線と慢線を用いて通路を構築する。快線は反応速度が速く,慢線は滑らか度が高く。双線突破を組み合わせてトレンド方向を判断する。
-
突破エントリー:価格が上方通路を突破するときに多めに,下方通路を突破するときに空にする. ストップ・ストップ・シングル・ストップの方法を採用してリスクを軽減する.
-
撤回出口:最大撤回をリアルタイムで監視する.撤回出口に達すると,平仓を積極的に停止する.撤回出口は,市場状況に応じて調整することができる.
-
持仓規模自律化:持仓数量は,口座権益に応じてリアルタイムで調整し,市場リスクを回避する.口座の撤回が大きいほど,持仓が少ないほど,リスクに対する抵抗力が強くなる.
戦略的優位性
-
双軌通路+突破エントリーにより,トレンドの判断がより正確になります.
-
単一損失を効率的に制御する止損防止機構.
-
アカウントの撤収をリアルタイムで監視し,ポジションの規模を主動的に調整し,市場リスクを軽減します.
-
持仓規模は口座の利権と関連しており,リスク抵抗性が強く,市場の変動に対応できる.
戦略リスク
-
大規模な震動の際には,撤退制御が効果をなくし,損失が拡大する可能性があります.
-
快線が中立区域に入ると,複数の無効突破信号が発生する可能性がある.
-
スローラインが滑らかすぎて,速度の逆転を捕まえられない.
-
多空間の混用の場合,双方向の倉庫保有は,収監の危険性がある.
戦略最適化の方向性
-
大規模な地震の場合は,過剰な止損を避けるために,より高い撤退の許容度を設定できます.
-
中立領域のフィルタリングを追加し,中立領域の無効信号を回避する.
-
スローライン通路のパラメータを最適化し,高速走行状況への反応速度を向上させる.
-
倉庫開き規則を追加し,両方向に倉庫を閉じ込めるのを避ける.
要約する
この戦略は,全体的に中長期トレンドの取引に適した有効な戦略である.戦略の最大の優点は,リアルタイムで撤回モニタリングと動的にポジション調整である.これは,戦略が,ポジションの規模を自動的に調整し,市場への強い適応能力を有することを可能にする.大幅な情勢の突発や価格の揺れが起きたとき,戦略は,ポジションの規模を自動的に削減し,損失の拡大を効果的に防止することができる.これは,多くの従来の戦略が行うのは難しい.全体的に言えば,この戦略のアイデアは新鮮で,強力な実用性がある.探索と最適化の価値があります.
//Noro
//2020

//Original idea from «Way of the Turtle: The Secret Methods that Turned Ordinary People into Legendary Traders» (2007, CURTIS FAITH, ISBN: 9780071486644)

//@version=4
strategy("Noro's Turtles Strategy", shorttitle = "Turtles str", overlay = true, default_qty_type = strategy.percent_of_equity, initial_capital = 100, default_qty_value = 100, commission_value = 0.1)

//Settings
needlong = input(true, title = "Long")
needshort = input(false, title = "Short")
sizelong = input(100, defval = 100, minval = 1, maxval = 10000, title = "Lot long, %")- 1