月末の勢いが200日移動平均戦略を突破

1
Follow
1779
Followers
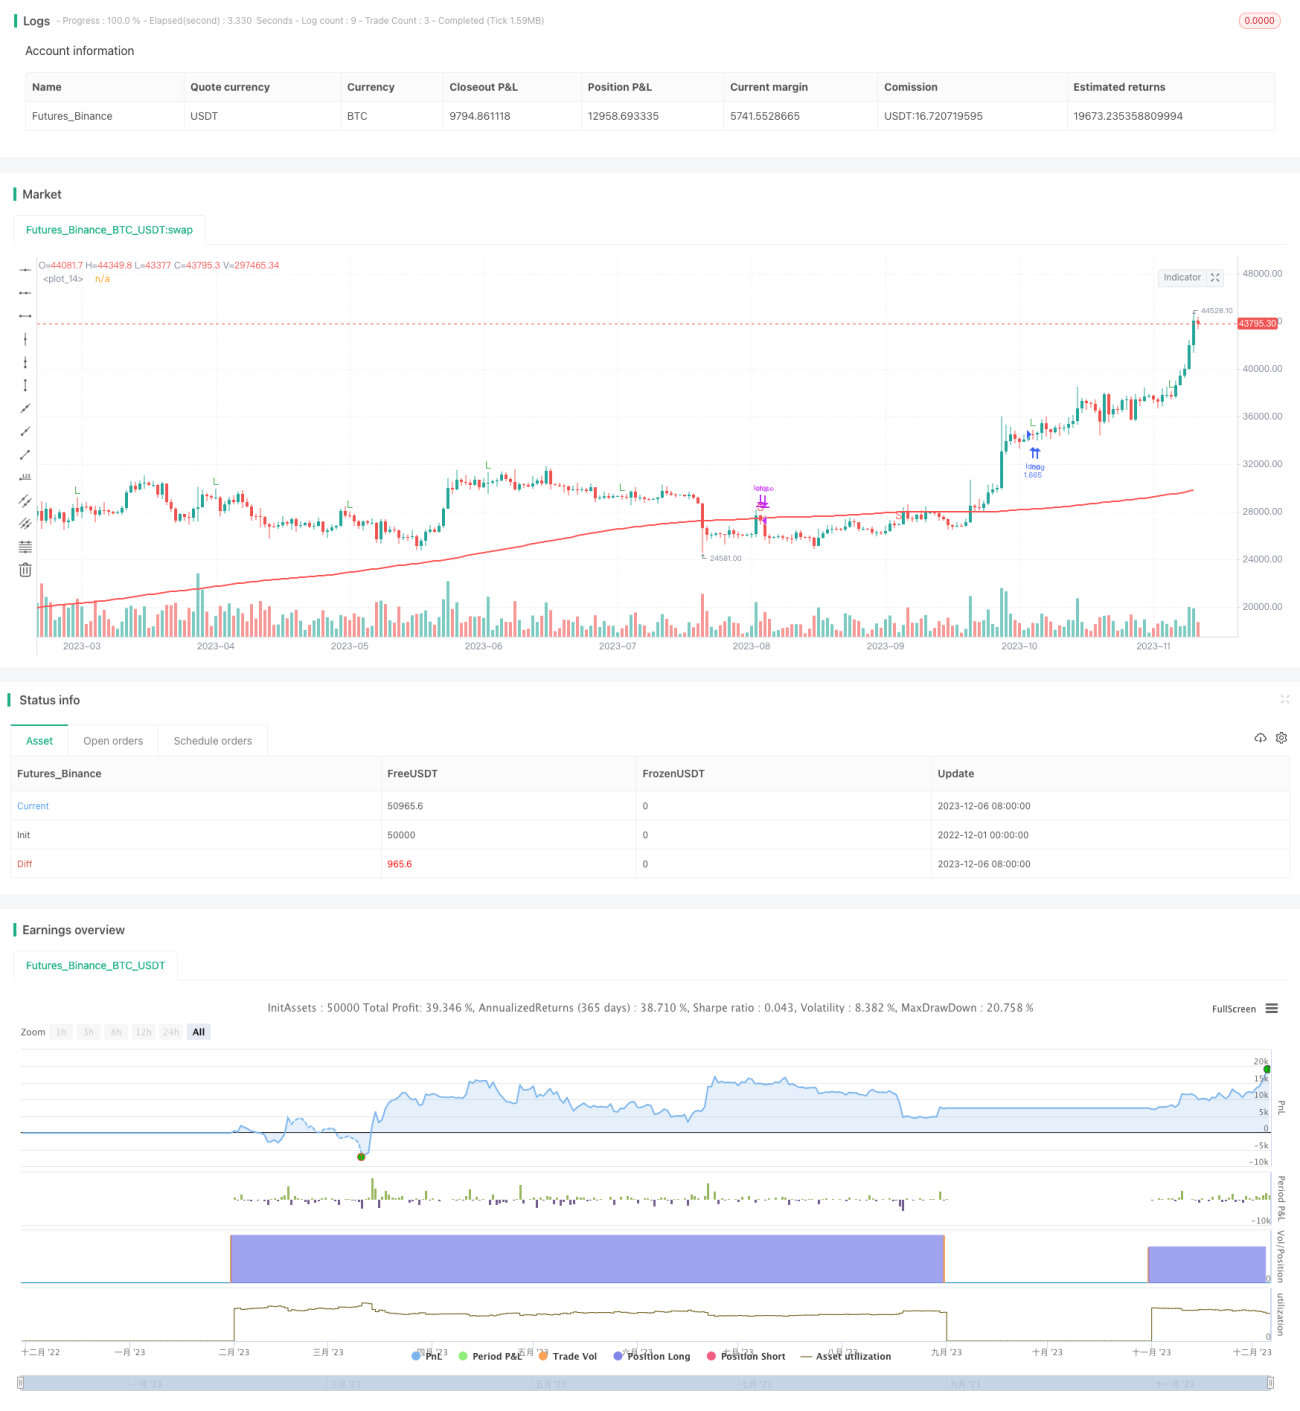
概要
この戦略は,株価が200日目移動平均を突破したかどうかを判断して,株価のトレンド方向を捉えるために,月末の時間点をベースにします.価格が200日目平均を突破したときに多頭ポジションを確立し,そうでなければ清算を待つ.
戦略原則
- 価格の動向を判断する指標として200日単行移動平均dma200を使用する
- 月の最後の取引日に,その日の閉盘価格がdma200以上であるかどうかを判断する
- 閉店価格が200日平均線を突破した場合,次の取引日の開場時に全仓の多項ポジションを確立する
- 閉盤価格が200日平均線を下回ると,次の取引日に清算を開始します.
- 株価が上昇傾向に入るとポジションを立て,下落傾向を回避する.
優位分析
- 戦略の強みは シンプルで効果的で 分かりやすく実行できるという点です
- 取引の頻度,取引コスト,滑り点の影響を減らすために,年末のポイントを活用する
- 200日平均線は,ほとんどの株式に有効な非常に一般的な中長期のトレンド判断指標です.
- 戦略的撤回と最大下落は小さく,リスクはコントロールできます.
リスク分析
- 200日平均線は,一部の株に敏感で,価格の変動を把握できない可能性があります.
- 月末には1つの取引先しかなかったので,中間の好転を逃したかもしれない.
- この戦略は,大盘の全体的な傾向が不確実なときに正しく判断できない可能性があります.
- これらのリスクは他の指標と組み合わせて 軽減されるべきです
最適化の方向
- 戦略の頻度を増やすため,月初頭または月中旬にポイントを増やすことも検討できます.
- 価格の変動を判断するブリン帯などの指標を追加し,誤った取引を避ける
3. 異なる均線パラメータが異なる株式に合う効果を評価し,最適なパラメータの組み合わせを探す - ダイナミックなポジション管理の仕組みを確立し,撤回が過大になったときに積極的な止損を行う
要約する
この戦略は,全体的にシンプルで実用的なもので,月末に200日平均線を突破する方法によって,株の長期価格傾向を効果的に捕捉し,撤回とリスクが小さい.より多くの指標判断と動態最適化と組み合わせることで,戦略の安定性と収益率をさらに強化することができる.
Source
Pine
/*backtest
start: 2022-12-01 00:00:00
end: 2023-12-07 00:00:00
period: 1d
basePeriod: 1h
exchanges: [{"eid":"Futures_Binance","currency":"BTC_USDT"}]
*/

// This source code is subject to the terms of the Mozilla Public License 2.0 at https://mozilla.org/MPL/2.0/
// © muscleriot
//200 dma
//2000-2016 backtested Strategy parameters
Related strategies
Comment
All comments (0)
No data
- 1