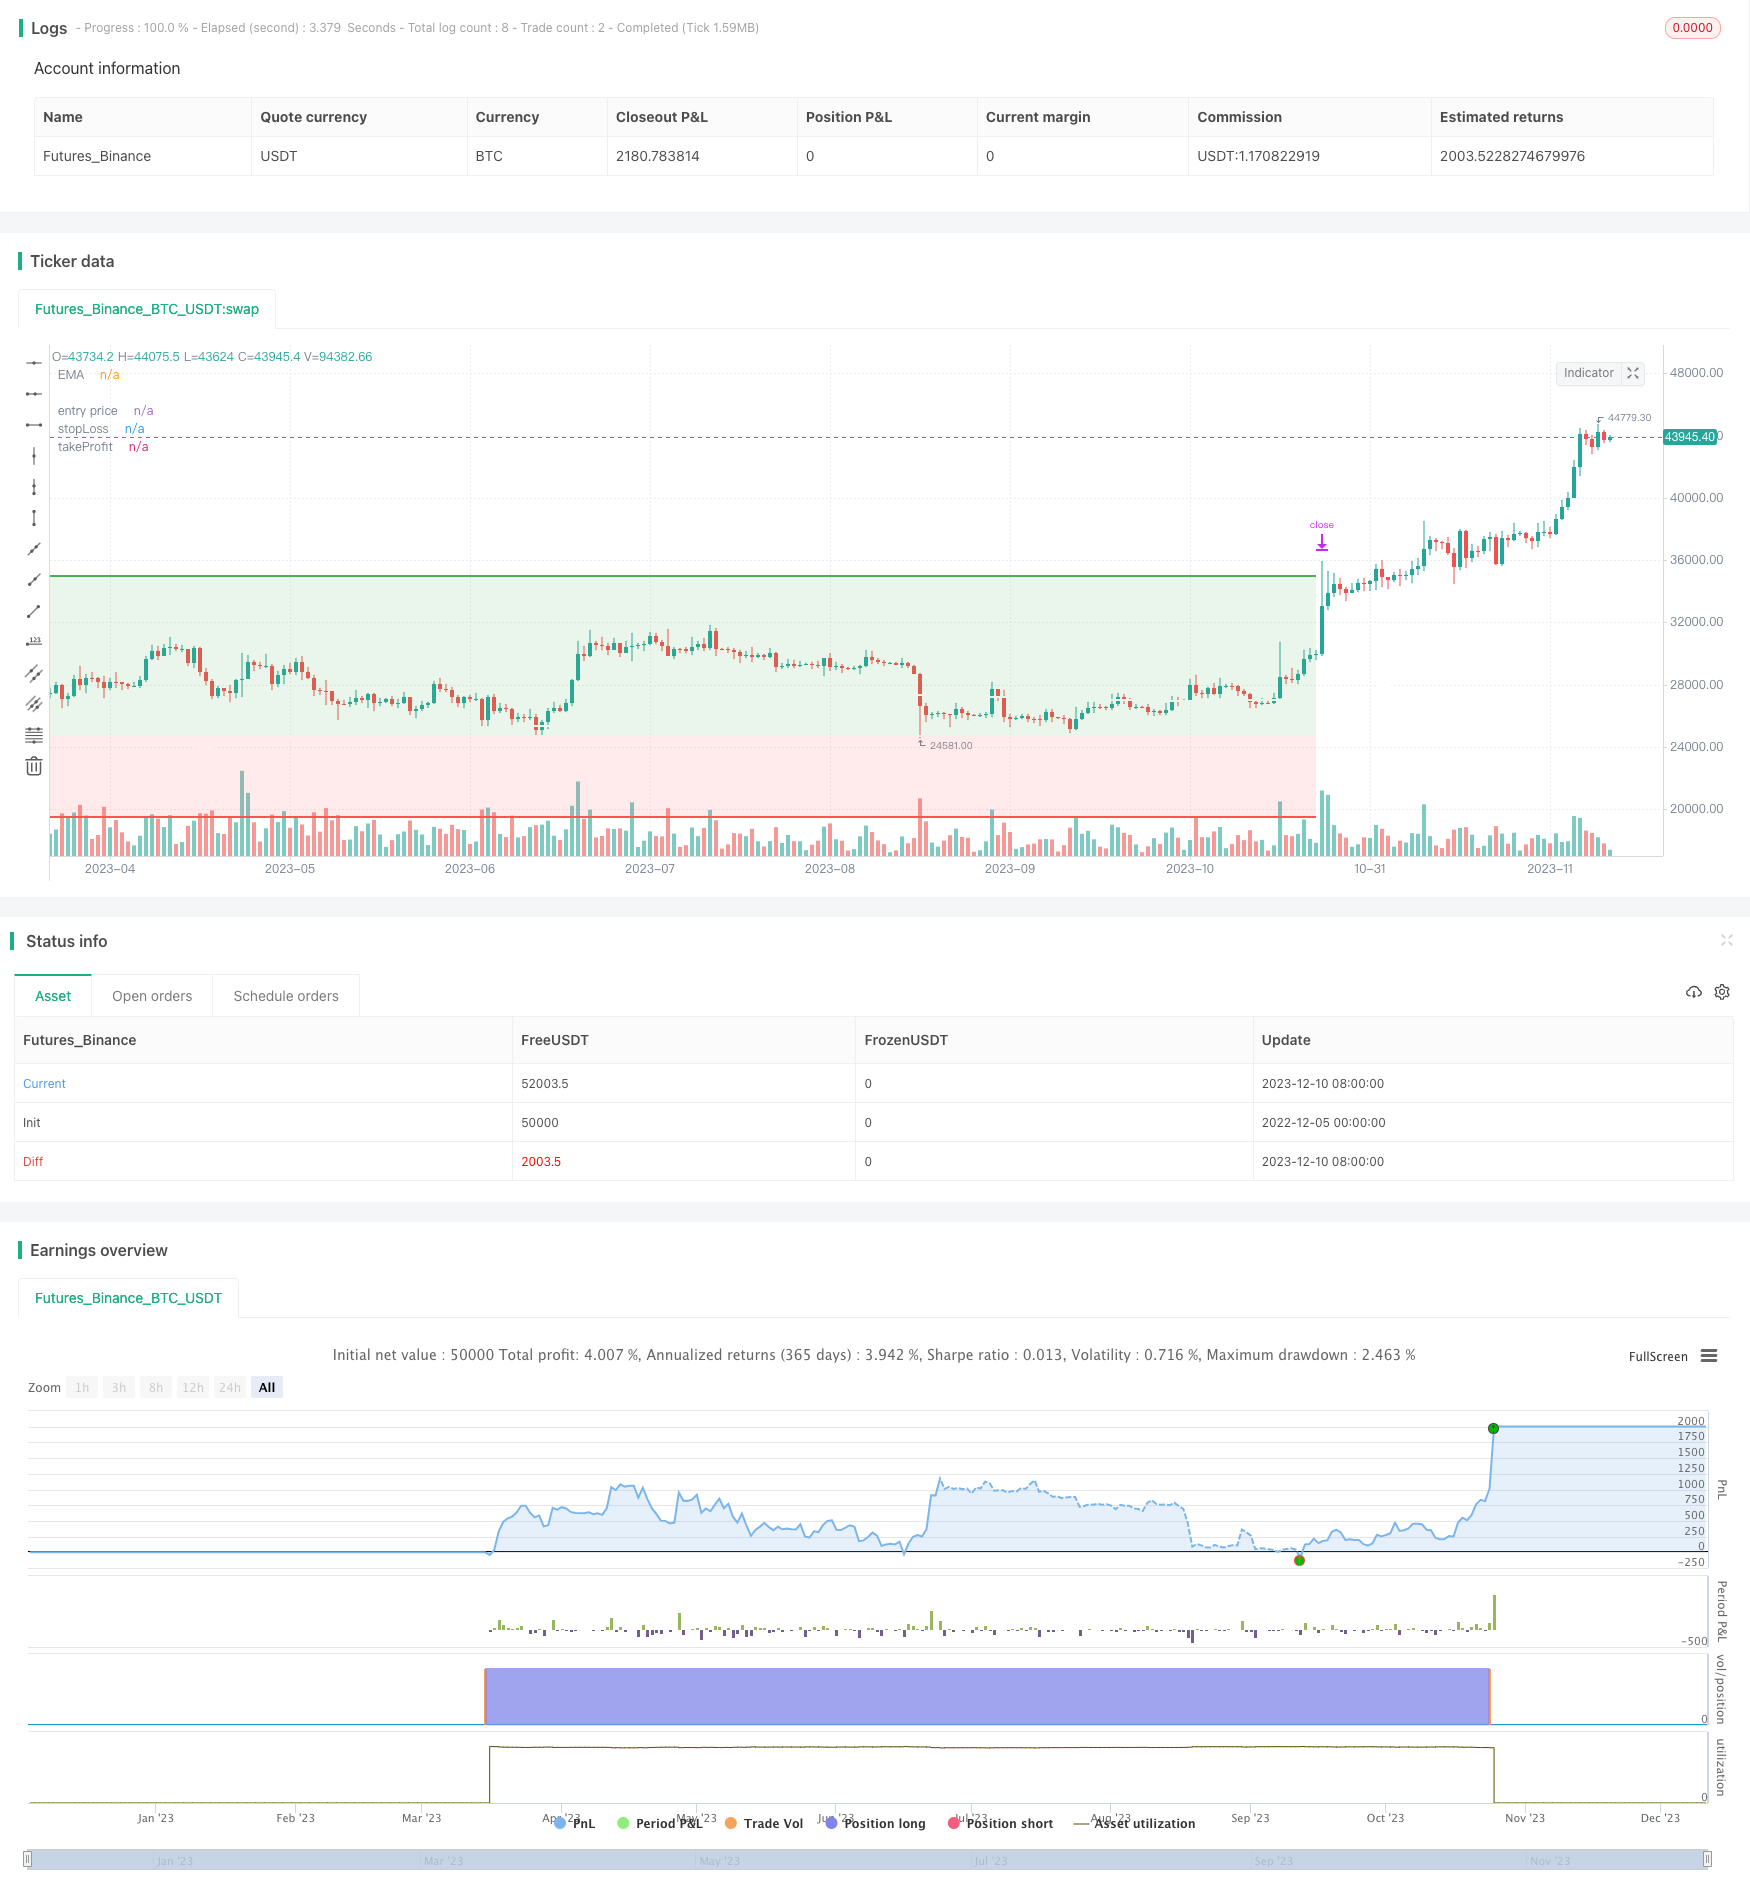
スイングトレード指標戦略

概要
この戦略は,移動平均指標 ((MACD) を使って多空信号を構築し,トレンドが良い条件で反転取引を行い,動的にオフポジションを設定することで利益を得ます.
戦略原則
この戦略は主にMACD指標の金叉多信号,死叉空信号に基づいている.具体的には,MACD線が下から上へ信号線を横切るときに金叉多信号を生じ,MACD線が上から下へ信号線を横切るときに死叉空信号を生じます.
ゴールドフォーク信号が来る時,閉盘価格がEMA平均線より高い場合は,多めにする.死フォーク信号が来る時,閉盘価格がEMA平均線より低い場合は,空っぽにする.これにより,大トレンドの下での反転取引を保証することができる.
入場後,ストップ・ロストとストップ・ロストを動的に使用する戦略.具体的には,複数のストップ・ロストを入場価格に設定する.(1-最大値下げ); ストップポジションを入場価格に設定します.(1+TARGET_STOP_RATIO*最大下落) 〔空札設定の逆〕.最大下落は動的に計算され,スウィングローから閉店価格のパーセントの下落空間を表します.TARGET_STOP_RATIOは,2を默認し,損益比は2である。
このようなオフポジションの設定の利点は,市場の変動状況に応じて動的に損失比率とストップポジションを調整できる点である.大きな変動の際にはオフポジションの急速な停止,小さな変動の際にはストップポジションを追跡する点である.
戦略的優位性
MACD指標を使って多空信号を構築することで,価格の逆転のタイミングを効果的に判断することができる.
EMA均線と組み合わせたフィルターで,入場時にトレンドアップ状態を選択し,逆転取引を避ける.
ダイナミックなオフフィールド制御システムで,利益率とストップ・ローズをリアルタイムで調整し,高い利益を追求しながらリスクを制御します.
市場の変動を考慮して,離場速度が速いため,市時間を短縮することができ,忙しい投資家の方が適しています.
リスクと解決策
MACD指標は横横整理された市場ではしばしば偽信号を引き起こす. 解決策は,平線をフィルターとして加え,逆転取引を避けることである.
DYNAMIC STOPは,極端に変動する市場では,過度に緩やかなストップを引き起こすが,ほとんどのシナリオではうまく機能する.極端な状況に遭遇した場合,固定利回りを考慮することができます.
利益の余地が限られ,利益を追求するために頻繁に取引する必要がある.これは,投資家が一定の心理的耐性と時間投入を必要とする.暇な操作がない場合は,高周期に調整することを考えることができる.
最適化の方向
特定の品種特性に合わせてMACDパラメータを調整し,金叉死叉取引の効果を最適化する.
異なる移動平均をトレンドの指標としてテストし,よりよいフィルターを探します.
TARGET_STOP_RATIO,最大下落計算方法をテストし,ストップ・ストップ・ロスの戦略を最適化する.
取引量の変化や波動率などの他の条件判断を加え,信号の質を向上させる.
機械学習アルゴリズムで特性を磨き,動的多要素モデルを構築し,よりスマートなストップ・ストップ・ロスを実現する.
要約する
この戦略は,全体として強力な実用性を持っています. MACDを核心取引信号として,トレンド判断と動的オフフィールド制御の2つの補助モジュールを追加することで,MACD自体の取引効果を大幅に向上させることができます. ストップ・ストップ・ロスは,戦略の最適化の重点方向であり,この戦略は,この点で多くの革新が行われ,さらなる研究と応用に値しています.
/*backtest
start: 2022-12-05 00:00:00
end: 2023-12-11 00:00:00
period: 1d
basePeriod: 1h
exchanges: [{"eid":"Futures_Binance","currency":"BTC_USDT"}]
*/

// This source code is subject to the terms of the Mozilla Public License 2.0 at https://mozilla.org/MPL/2.0/
// © maxencetajet

//@version=5
strategy("MACD Strategy", overlay=true, initial_capital=1000, slippage=25)

src = input(title="Source", defval=close)
target_stop_ratio = input.float(title='Risk/Reward', defval=2, minval=0.5, maxval=100)
risk = input.float(2, title="Risk per Trade %")

riskt = risk / 100 + 1

useDateFilter = input.bool(true, title="Filter Date Range of Backtest",
     group="Backtest Time Period")
backtestStartDate = input(timestamp("5 June 2022"),
     title="Start Date", group="Backtest Time Period",
     tooltip="This start date is in the time zone of the exchange " +
     "where the chart's instrument trades. It doesn't use the time " +
     "zone of the chart or of your computer.")
backtestEndDate = input(timestamp("5 July 2022"),
     title="End Date", group="Backtest Time Period",
     tooltip="This end date is in the time zone of the exchange " +
     "where the chart's instrument trades. It doesn't use the time " +
     "zone of the chart or of your computer.")

inTradeWindow =  true
emaV = input.int(200, title="Length", group="EMA")
swingHighV = input.int(7, title="Swing High", group="number of past candles")
swingLowV = input.int(7, title="Swing Low", group="number of past candles")

ema = ta.ema(src, emaV)

fast_length = input(title="Fast Length", defval=12, group="MACD")
slow_length = input(title="Slow Length", defval=26, group="MACD")
signal_length = input.int(title="Signal Smoothing",  minval = 1, maxval = 50, defval = 9, group="MACD")
sma_source = input.string(title="Oscillator MA Type",  defval="EMA", options=["SMA", "EMA"], group="MACD")
sma_signal = input.string(title="Signal Line MA Type", defval="EMA", options=["SMA", "EMA"], group="MACD")

fast_ma = sma_source == "SMA" ? ta.sma(src, fast_length) : ta.ema(src, fast_length)
slow_ma = sma_source == "SMA" ? ta.sma(src, slow_length) : ta.ema(src, slow_length)
macd = fast_ma - slow_ma
signal = sma_signal == "SMA" ? ta.sma(macd, signal_length) : ta.ema(macd, signal_length)
hist = macd - signal

longcondition = close > ema and ta.crossover(macd, signal) and macd < 0
shortcondition = close < ema and ta.crossunder(macd, signal) and macd > 0

float risk_long = na
float risk_short = na
float stopLoss = na
float takeProfit = na
float entry_price = na

risk_long := risk_long[1]
risk_short := risk_short[1]

swingHigh = ta.highest(high, swingHighV)
swingLow = ta.lowest(low, swingLowV)

lotB = (strategy.equity*riskt-strategy.equity)/(close - swingLow)
lotS = (strategy.equity*riskt-strategy.equity)/(swingHigh - close)

if strategy.position_size == 0 and longcondition and inTradeWindow
    risk_long := (close - swingLow) / close
    strategy.entry("long", strategy.long, qty=lotB)

if strategy.position_size == 0 and shortcondition and inTradeWindow
    risk_short := (swingHigh - close) / close
    strategy.entry("short", strategy.short, qty=lotS)

if strategy.position_size > 0

    stopLoss := strategy.position_avg_price * (1 - risk_long)
    takeProfit := strategy.position_avg_price * (1 + target_stop_ratio * risk_long)
    entry_price := strategy.position_avg_price
    strategy.exit("long exit", "long", stop = stopLoss, limit = takeProfit)

if strategy.position_size < 0

    stopLoss := strategy.position_avg_price * (1 + risk_short)
    takeProfit := strategy.position_avg_price * (1 - target_stop_ratio * risk_short)
    entry_price := strategy.position_avg_price
    strategy.exit("short exit", "short", stop = stopLoss, limit = takeProfit)

plot(ema, color=color.white, linewidth=2, title="EMA")
p_ep = plot(entry_price, color=color.new(color.white, 0), linewidth=2, style=plot.style_linebr, title='entry price')
p_sl = plot(stopLoss, color=color.new(color.red, 0), linewidth=2, style=plot.style_linebr, title='stopLoss')
p_tp = plot(takeProfit, color=color.new(color.green, 0), linewidth=2, style=plot.style_linebr, title='takeProfit')
fill(p_sl, p_ep, color.new(color.red, transp=85))
fill(p_tp, p_ep, color.new(color.green, transp=85))