モメンタム指標主導のトレンドフォロー取引戦略

1
Follow
1778
Followers
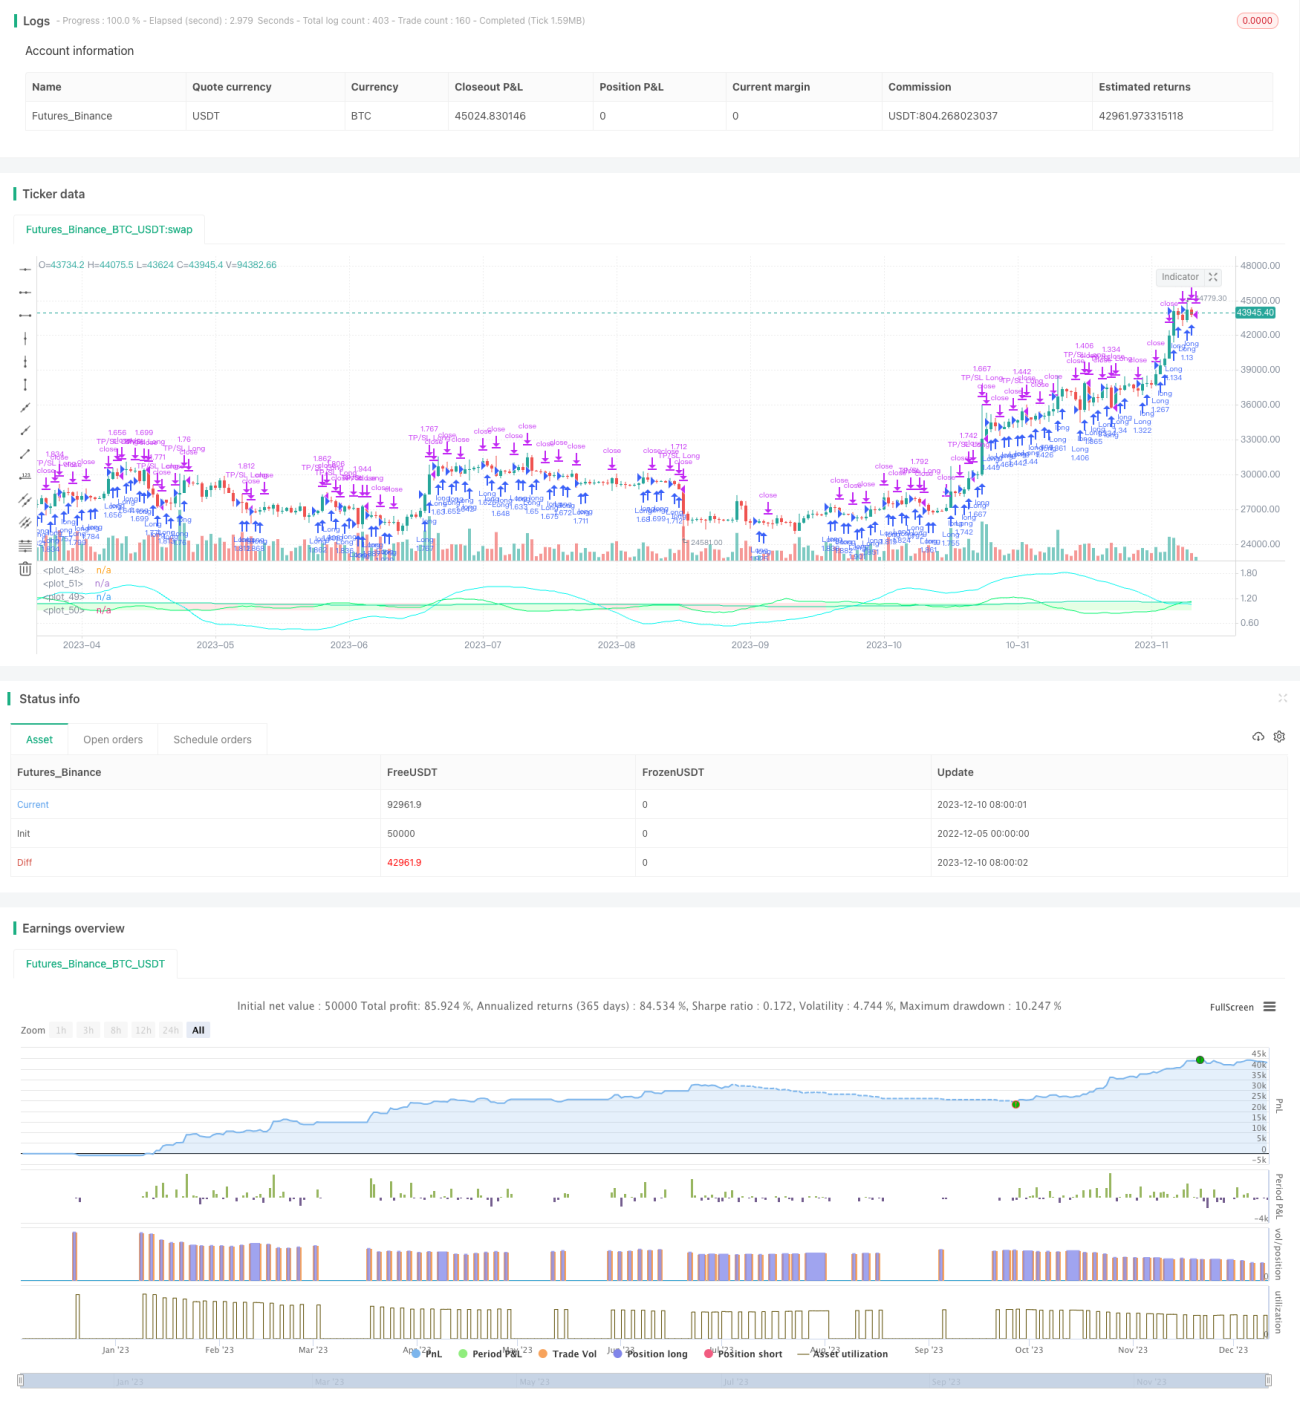
概要
この戦略は,指数関数移動平均 ((EMA) と価格の指数関数移動平均 ((SMA) による取引信号を構築しています. これはトレンドフォロー型の戦略です.
戦略原則
この戦略は,取引シグナルを生成するために3つの条件を使用します.
- RSI>45: RSIが45を超えると良い買い信号です.
- EMA (RSI) >SMA (RSI): EMA線がSMA線より大きいことは,RSIが上昇を加速していることを示し,良い運動信号である
- EMA ((閉店価格) > SMA ((閉店価格): EMA線がSMA線より大きいということは,価格トレンドが加速していることを示している.
上記の3つの条件のうち任意2つが満たされれば,買取シグナルが生成され,すべて満たされない場合は,売り込みシグナルが生成される.
この戦略は,システム自体の相対的な大盤のパフォーマンスをテストするために,<unk>は常に買って<unk>のモードを提供している.
戦略的優位分析
- 市場動態を判断するためにRSIの動態指標を使用すると,市場の揺れ期におけるポジションを減らすことができます.
- EMAとSMAとの組み合わせでトレンドの方向を判断し,価格変化のトレンドをタイムリーに捉える
- 条件の規則はシンプルで明快で,理解しやすく,最適化できます.
- <unk>の供給は常に<unk>のパターン検査システムで購入する
戦略的リスク分析
- パラメータの設定に依存し,不適切なパラメータにより取引が頻繁になるか,良い取引機会が失われる
- 大株が重大ニュースに遭遇すると,短期的な価格変動が大きくなり,ストップダストが起こる可能性があります.
- 戦略は,トレンドが逆転するタイミングを自分で判断できないので,他の指標と連携する必要があります.
最適化の方向
- RSI,EMA,SMAのパラメータを最適化し,最適なパラメータの組み合わせを見つける
- Volume,MACDなどの他の技術指標の判断ルールを追加
- トレンド反転判断指標を増加させ,損失の可能性を低減する
要約する
この戦略は,全体として,中期価格動向を捕捉し,短期市場の波動を回避することを目的とした中頻取引戦略の属性であり,その優位性とリスク点は明らかにあります.パラメータの最適化と規則の豊かさにより,戦略の安定性をさらに強化することができ,深入な研究と最適化の価値のある高効率の量化取引戦略です.
Source
Pine
/*backtest
start: 2022-12-05 00:00:00
end: 2023-12-11 00:00:00
period: 1d
basePeriod: 1h
exchanges: [{"eid":"Futures_Binance","currency":"BTC_USDT"}]
*/

//@version=5
strategy("I11L Unitrend",overlay=false, initial_capital=1000000,default_qty_value=1000000,default_qty_type=strategy.cash,commission_type=strategy.commission.percent,commission_value=0.00)
tradingMode = input.string("Unitrend", "Trading Mode", ["Unitrend", "Always Buy"], tooltip="Choose the Trading Mode by trying Both in your Backtesting. I use it if one is far better then the other one.")
compoundingMode = input.bool(false)Strategy parameters
Related strategies
Comment
All comments (0)
No data
- 1